Flow Field Portraits
A flowfield-based image filter
The Inspiration
I completed this project during my freshman year at Hendrix College. At the time, I was still learning to build larger scale projects, and this was one of my first self-directed large coding projects (large being relative). I was inspired by Tyler Hobbs and his flow field art, which he describes here. I was fascinated by the ways that small variations in the noise algorithms and seeding process in his images created wildly different art.
For my attempt, I wanted to explore how flow field images could be seeded by existing photographs, rather than noise. For most of my images, I used pictures of myself and my friends.
What is a Flow Field
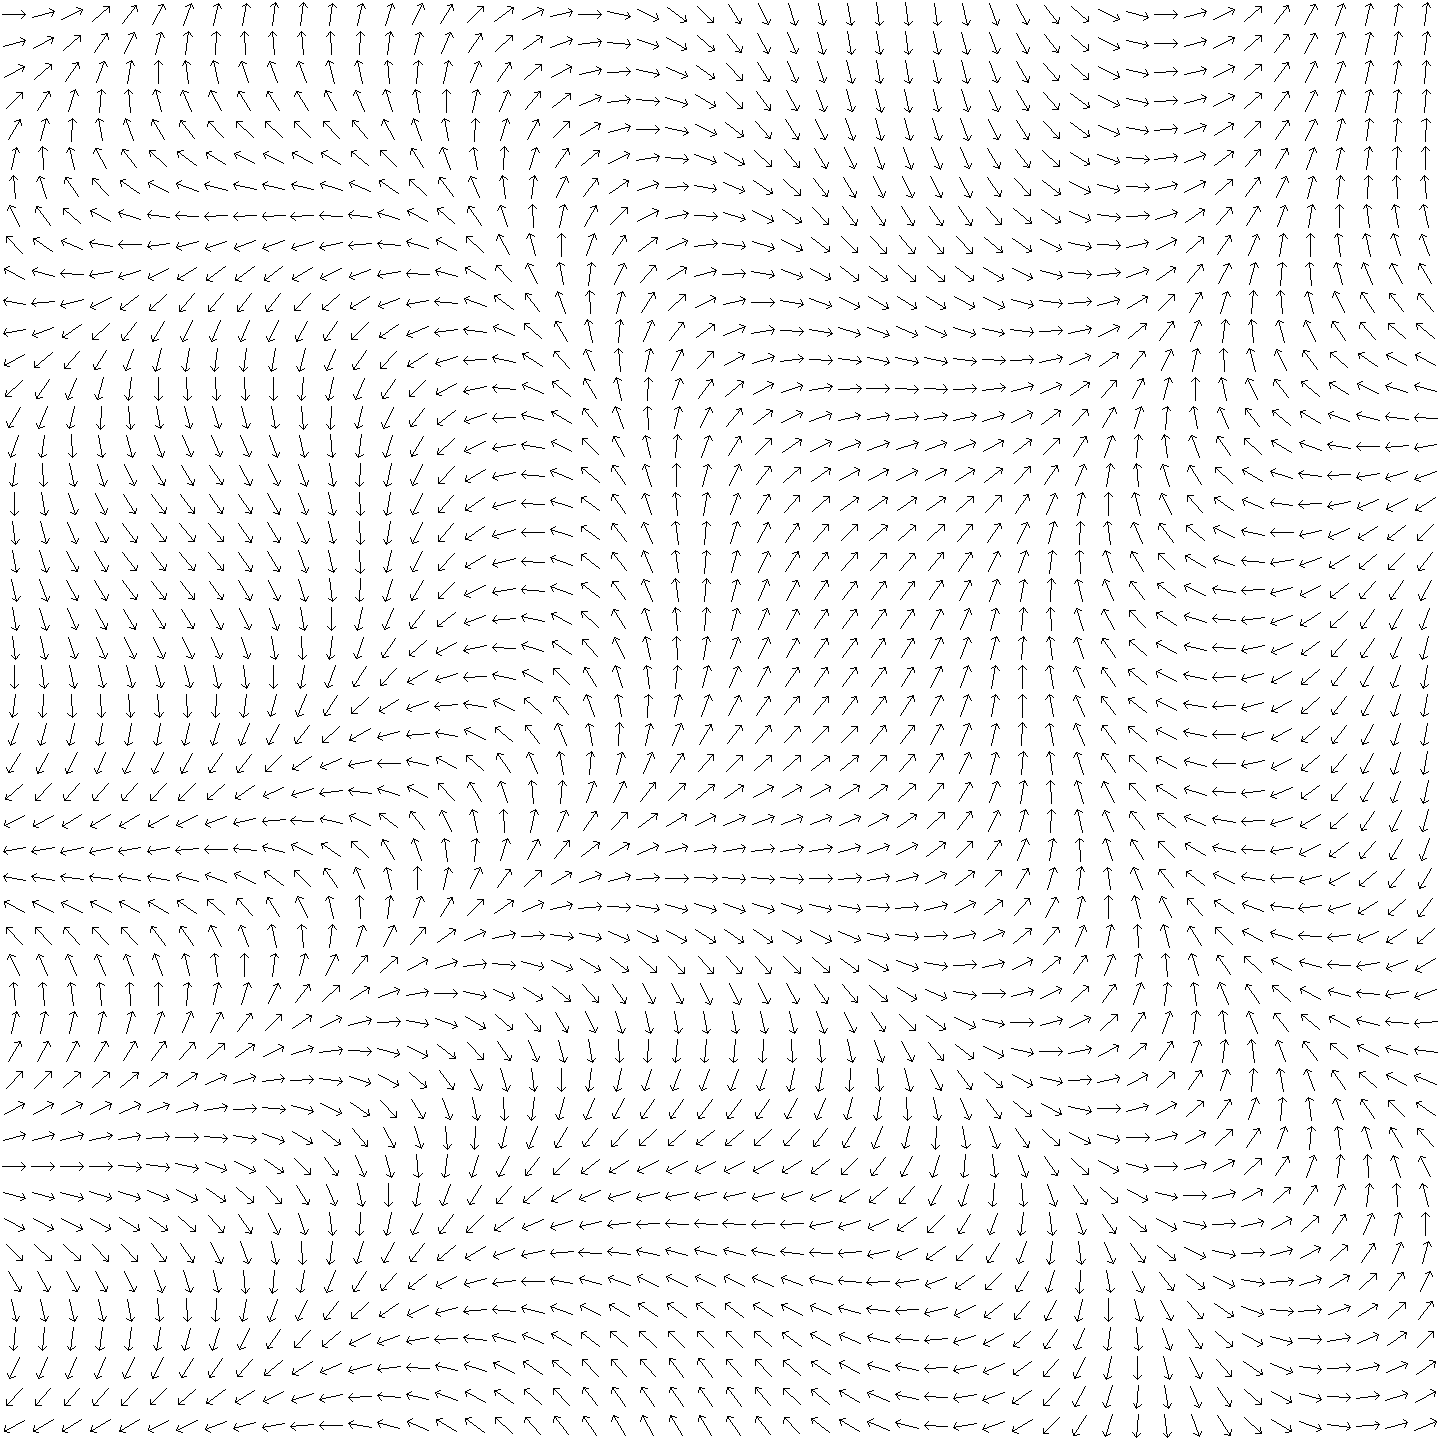
Also known as a vector field, a flow field is essentially a two-dimensional grid of vectors, representing the magnitude and direction of flow at a particular location. In my project, each grid location of the flow field represented a section of my image, rather than a single pixel. I used a variety of methods to relate the brightness and color of a section of the image to the corresponding vector, which I will describe later.
Once I had a field, I spawned lines using several different seeding techniques, which followed the flow, mimicking aspects of the form of the original image.
The Development Process
The First Version
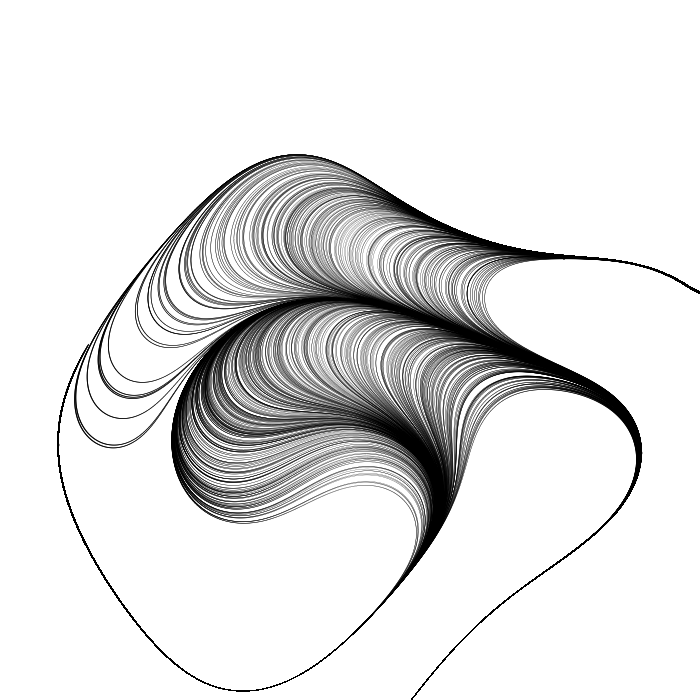
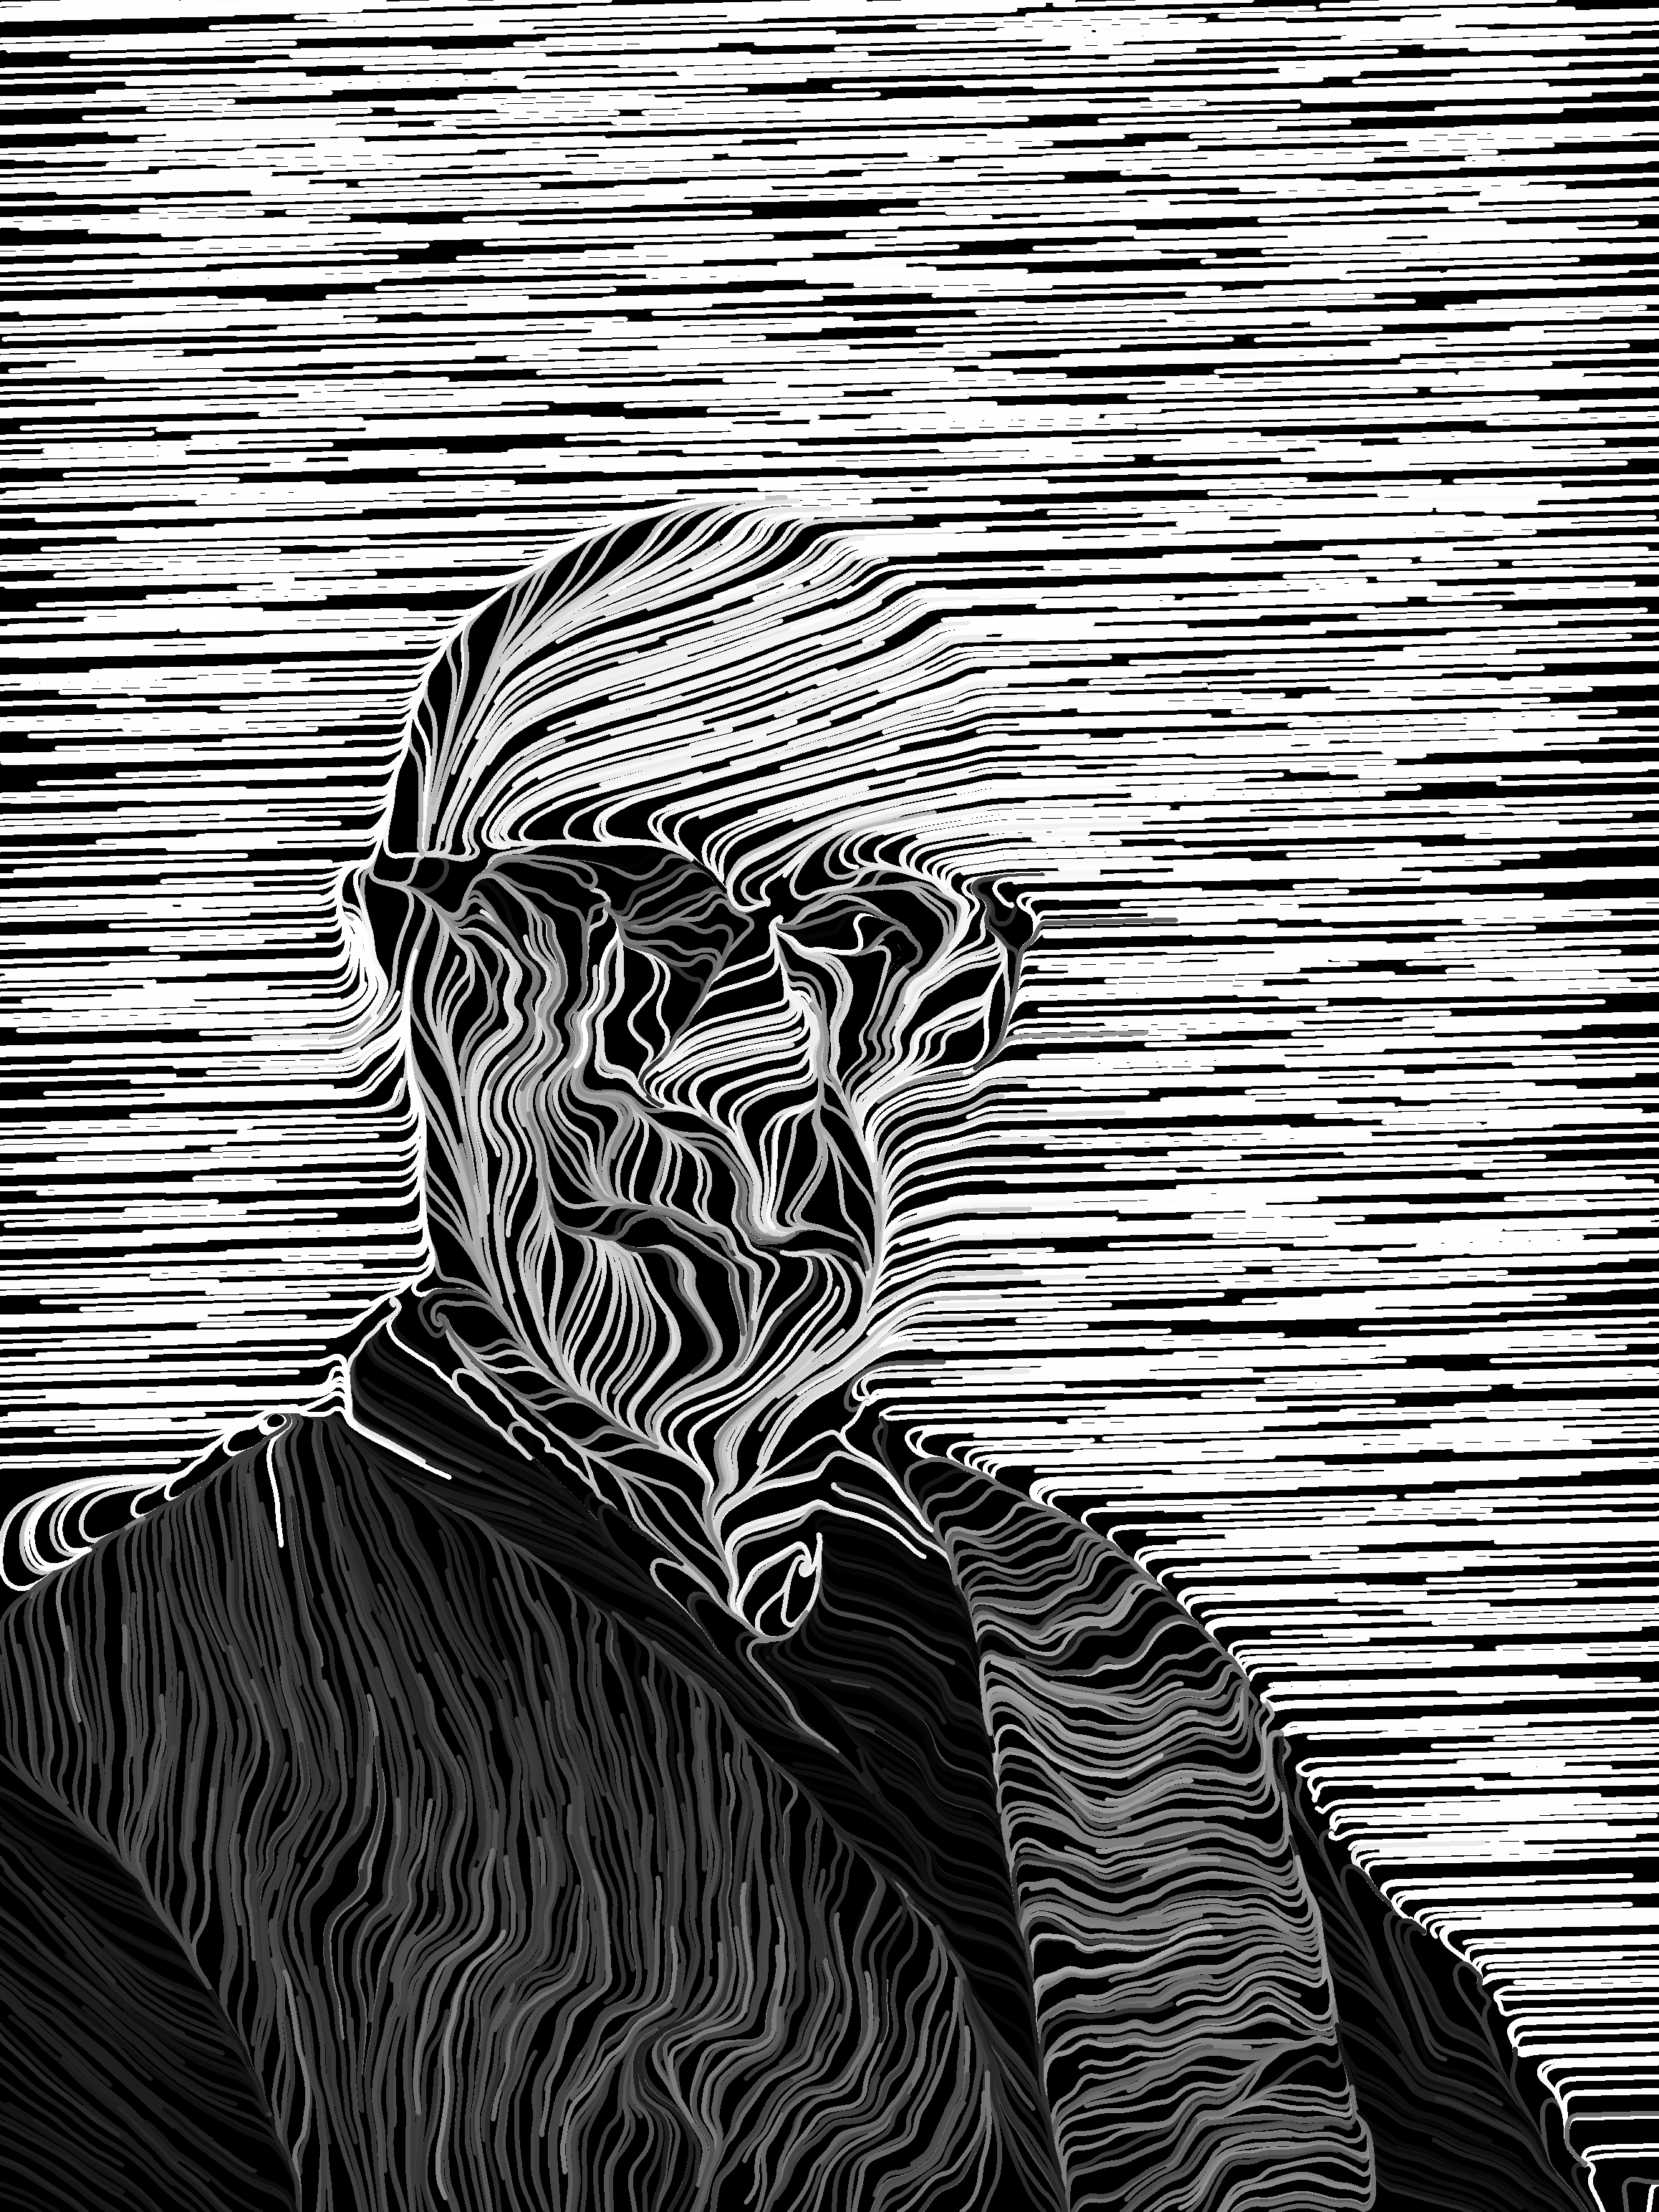
I started this project using libraries that I was familiar with at the time: OpenCV and MatPlotLib. The initial versions of code used OpenCV to read the pixels of the image, chose the angle of the vector in the flow field based off the average brightness of the grayscaled section of the image.
Once the field was generated, I used MatPlotLib to draw the lines, then converted the image to a png. This proved to be a bad decision, as MatPlotLib is not designed for efficiency and would take hours to generate a reasonably dense image.
Full OpenCV
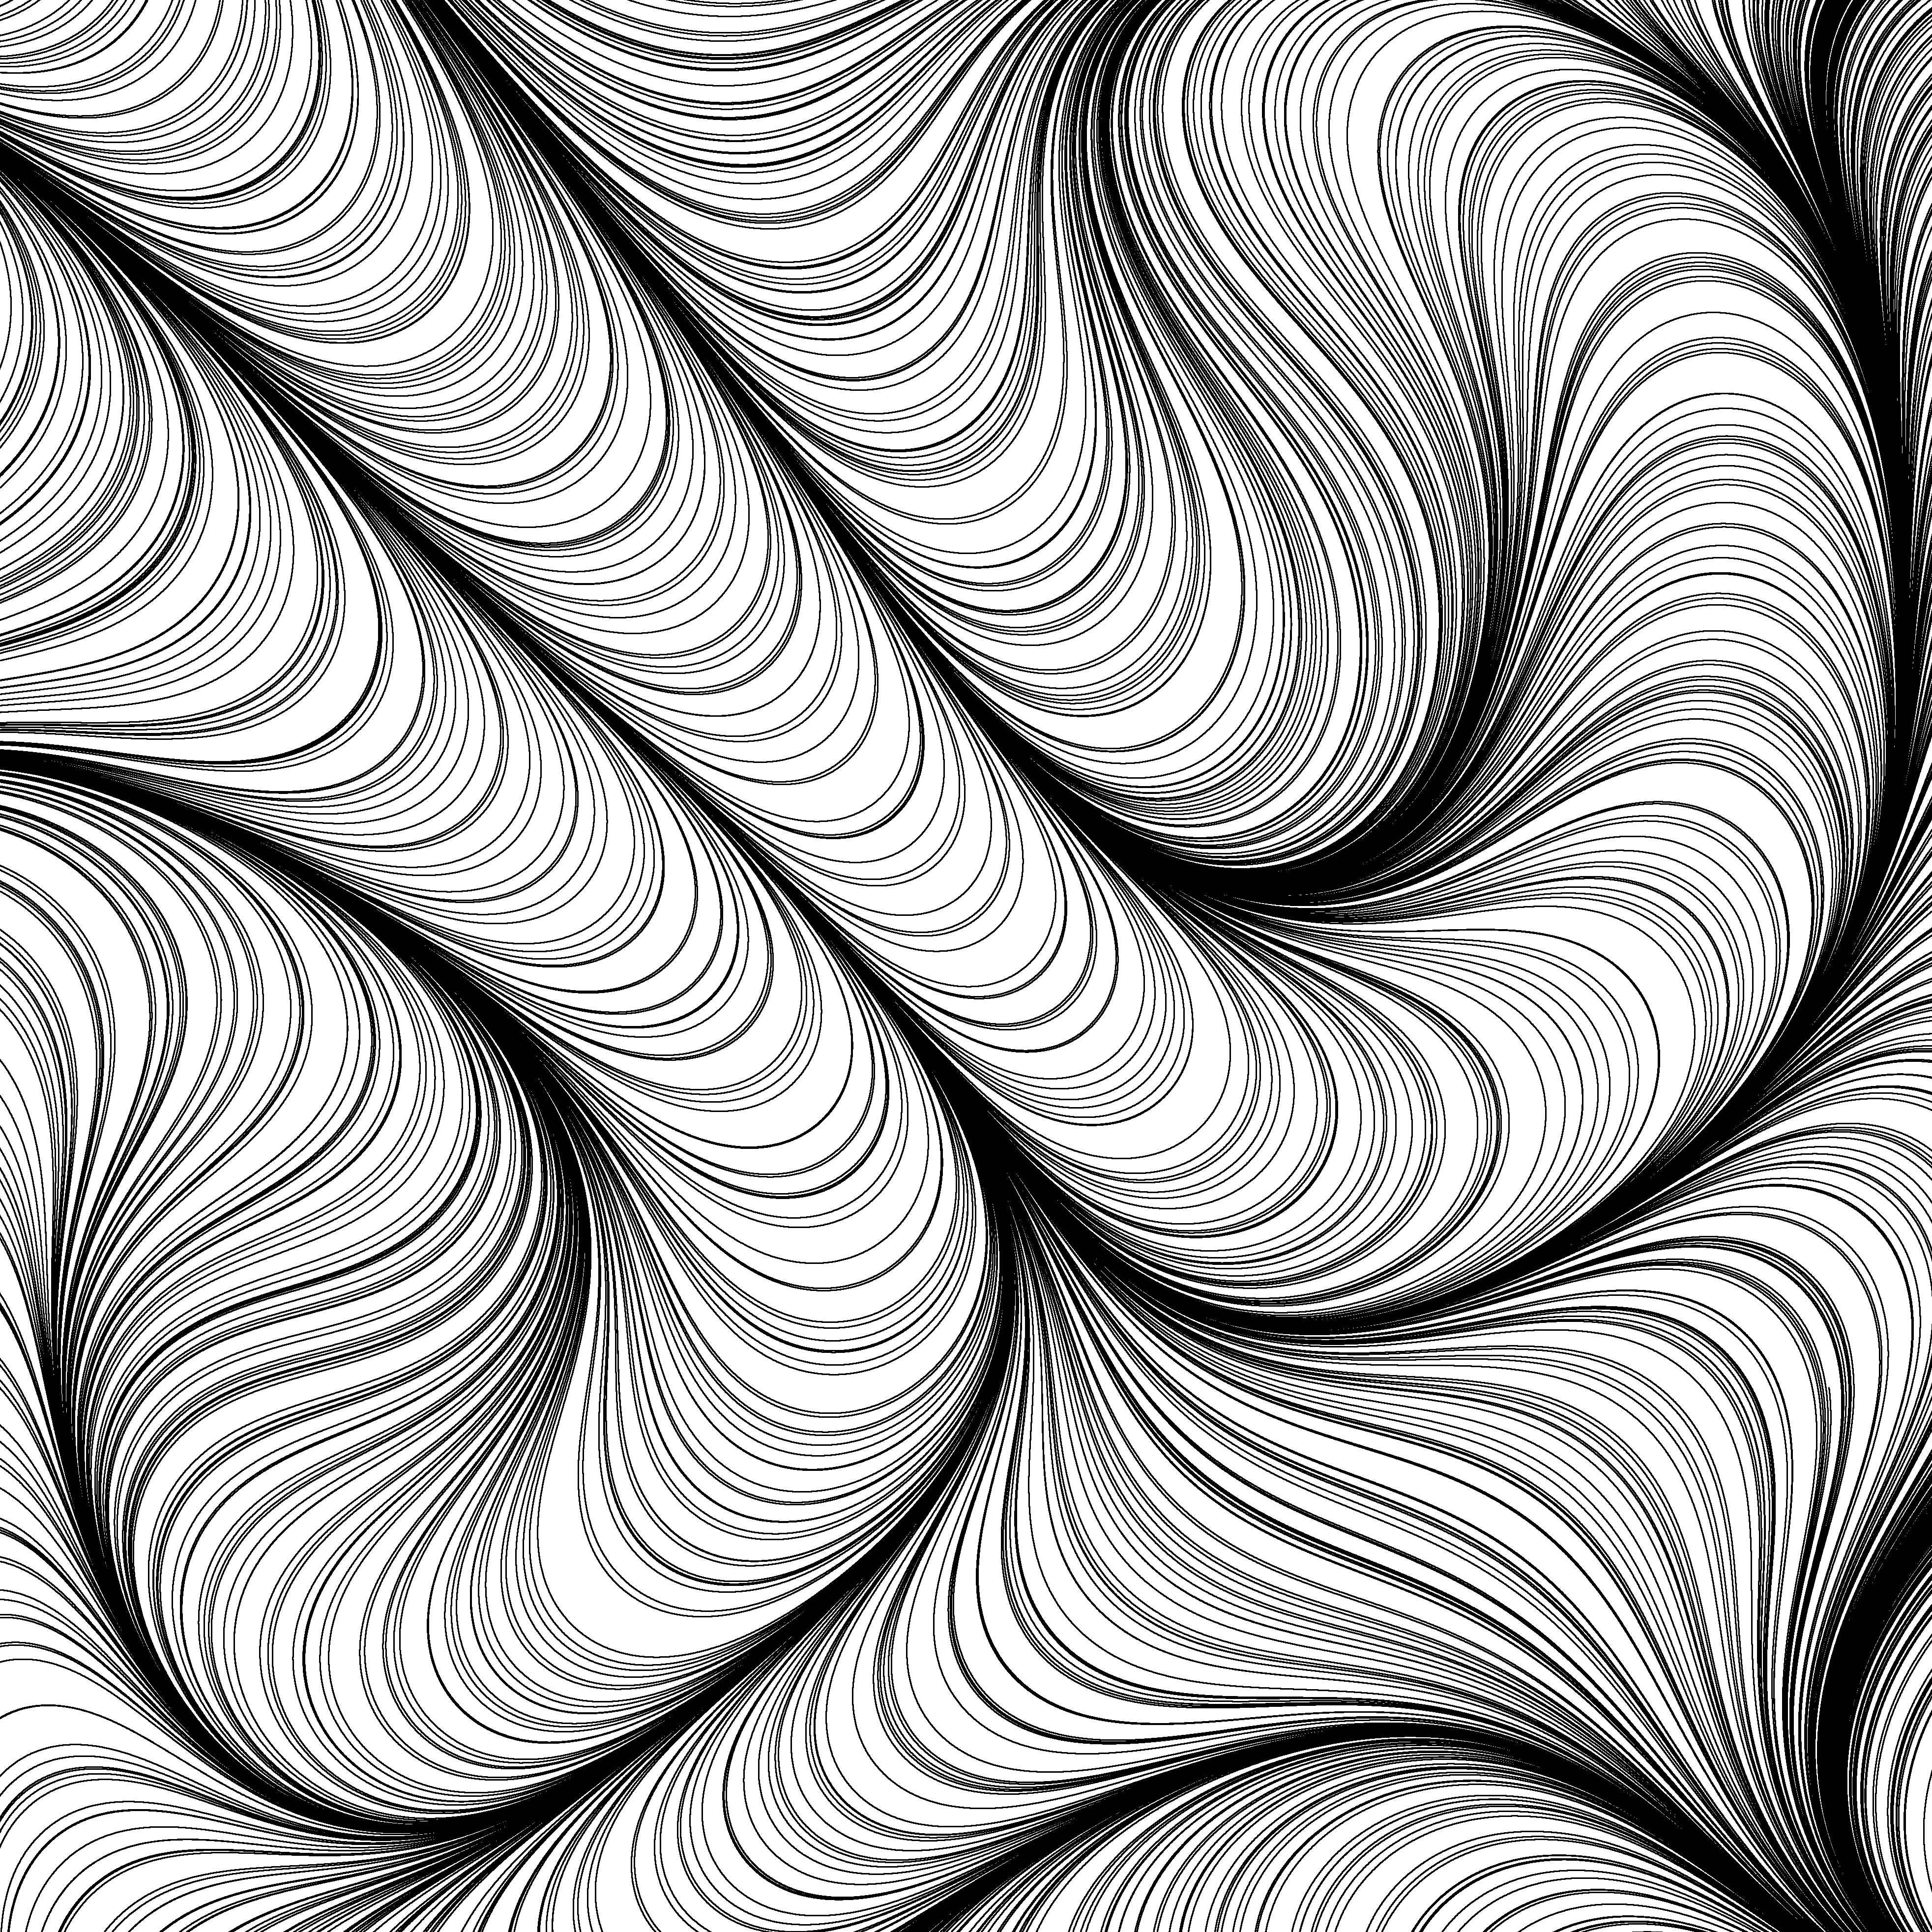
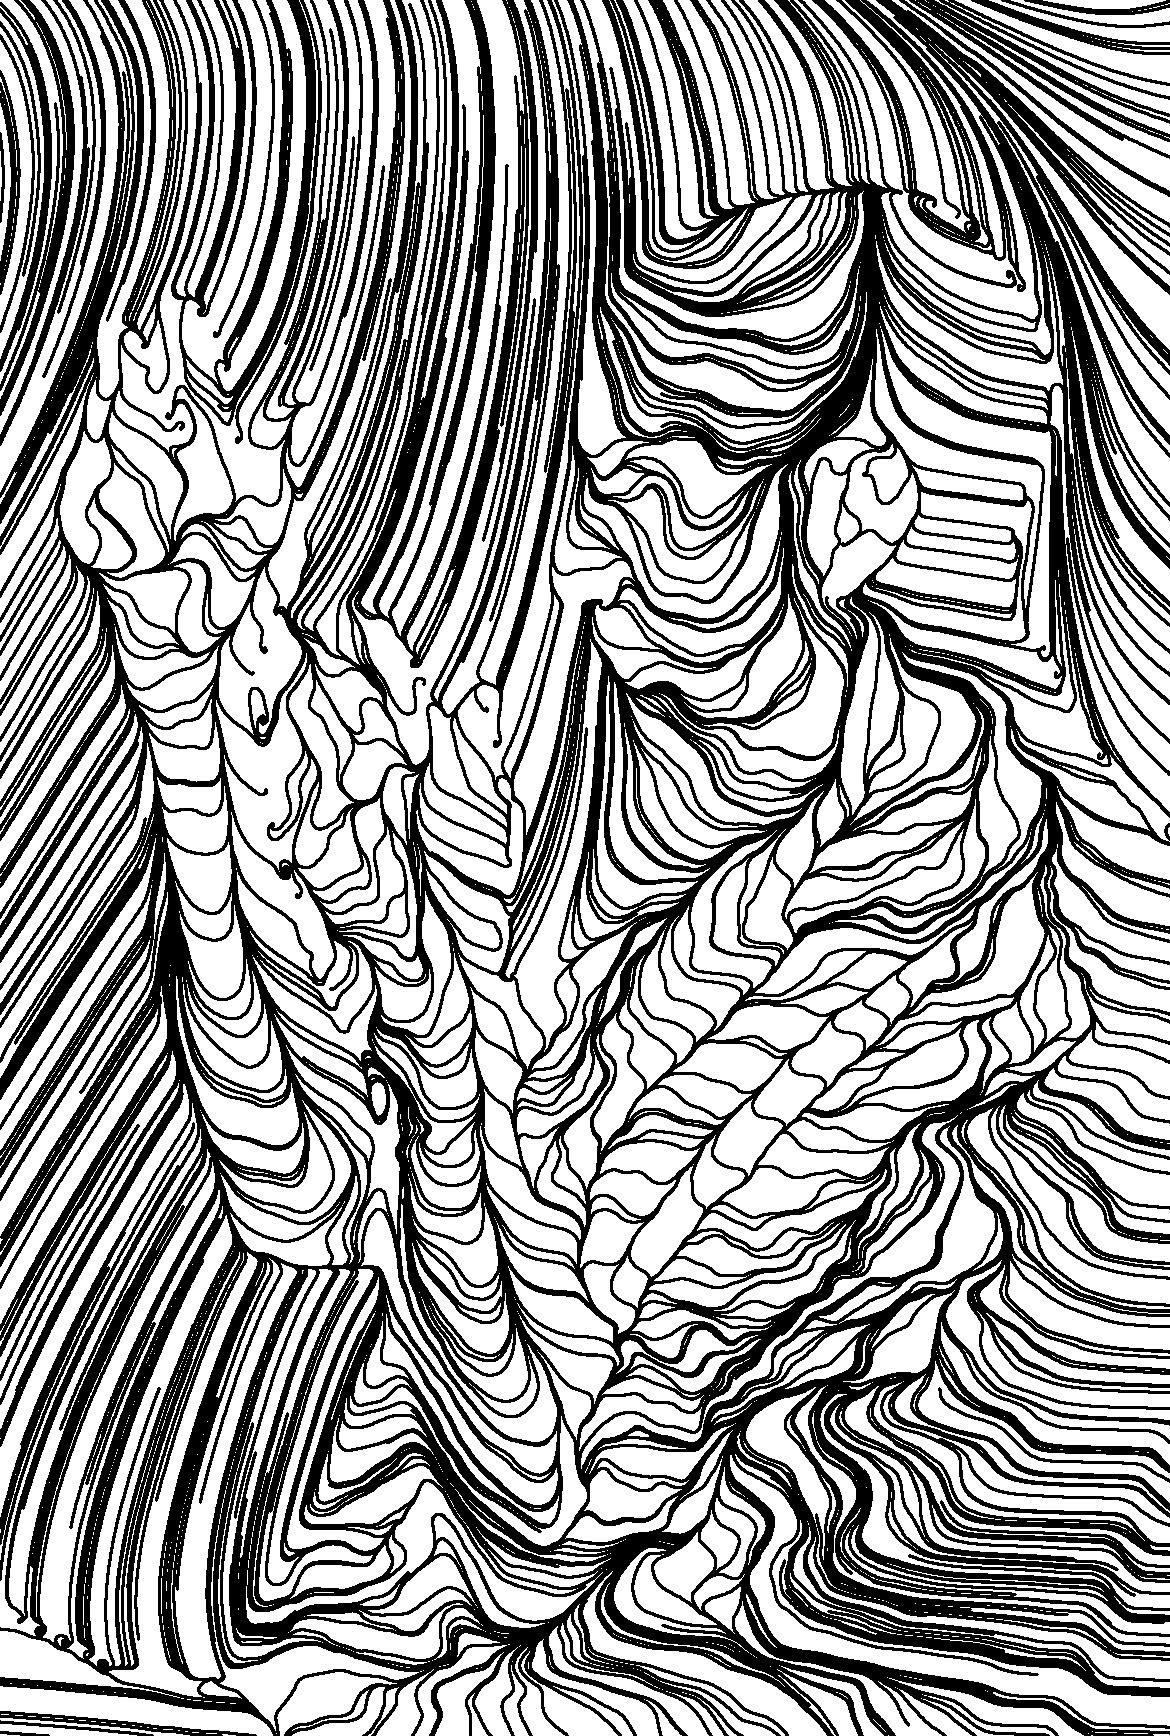
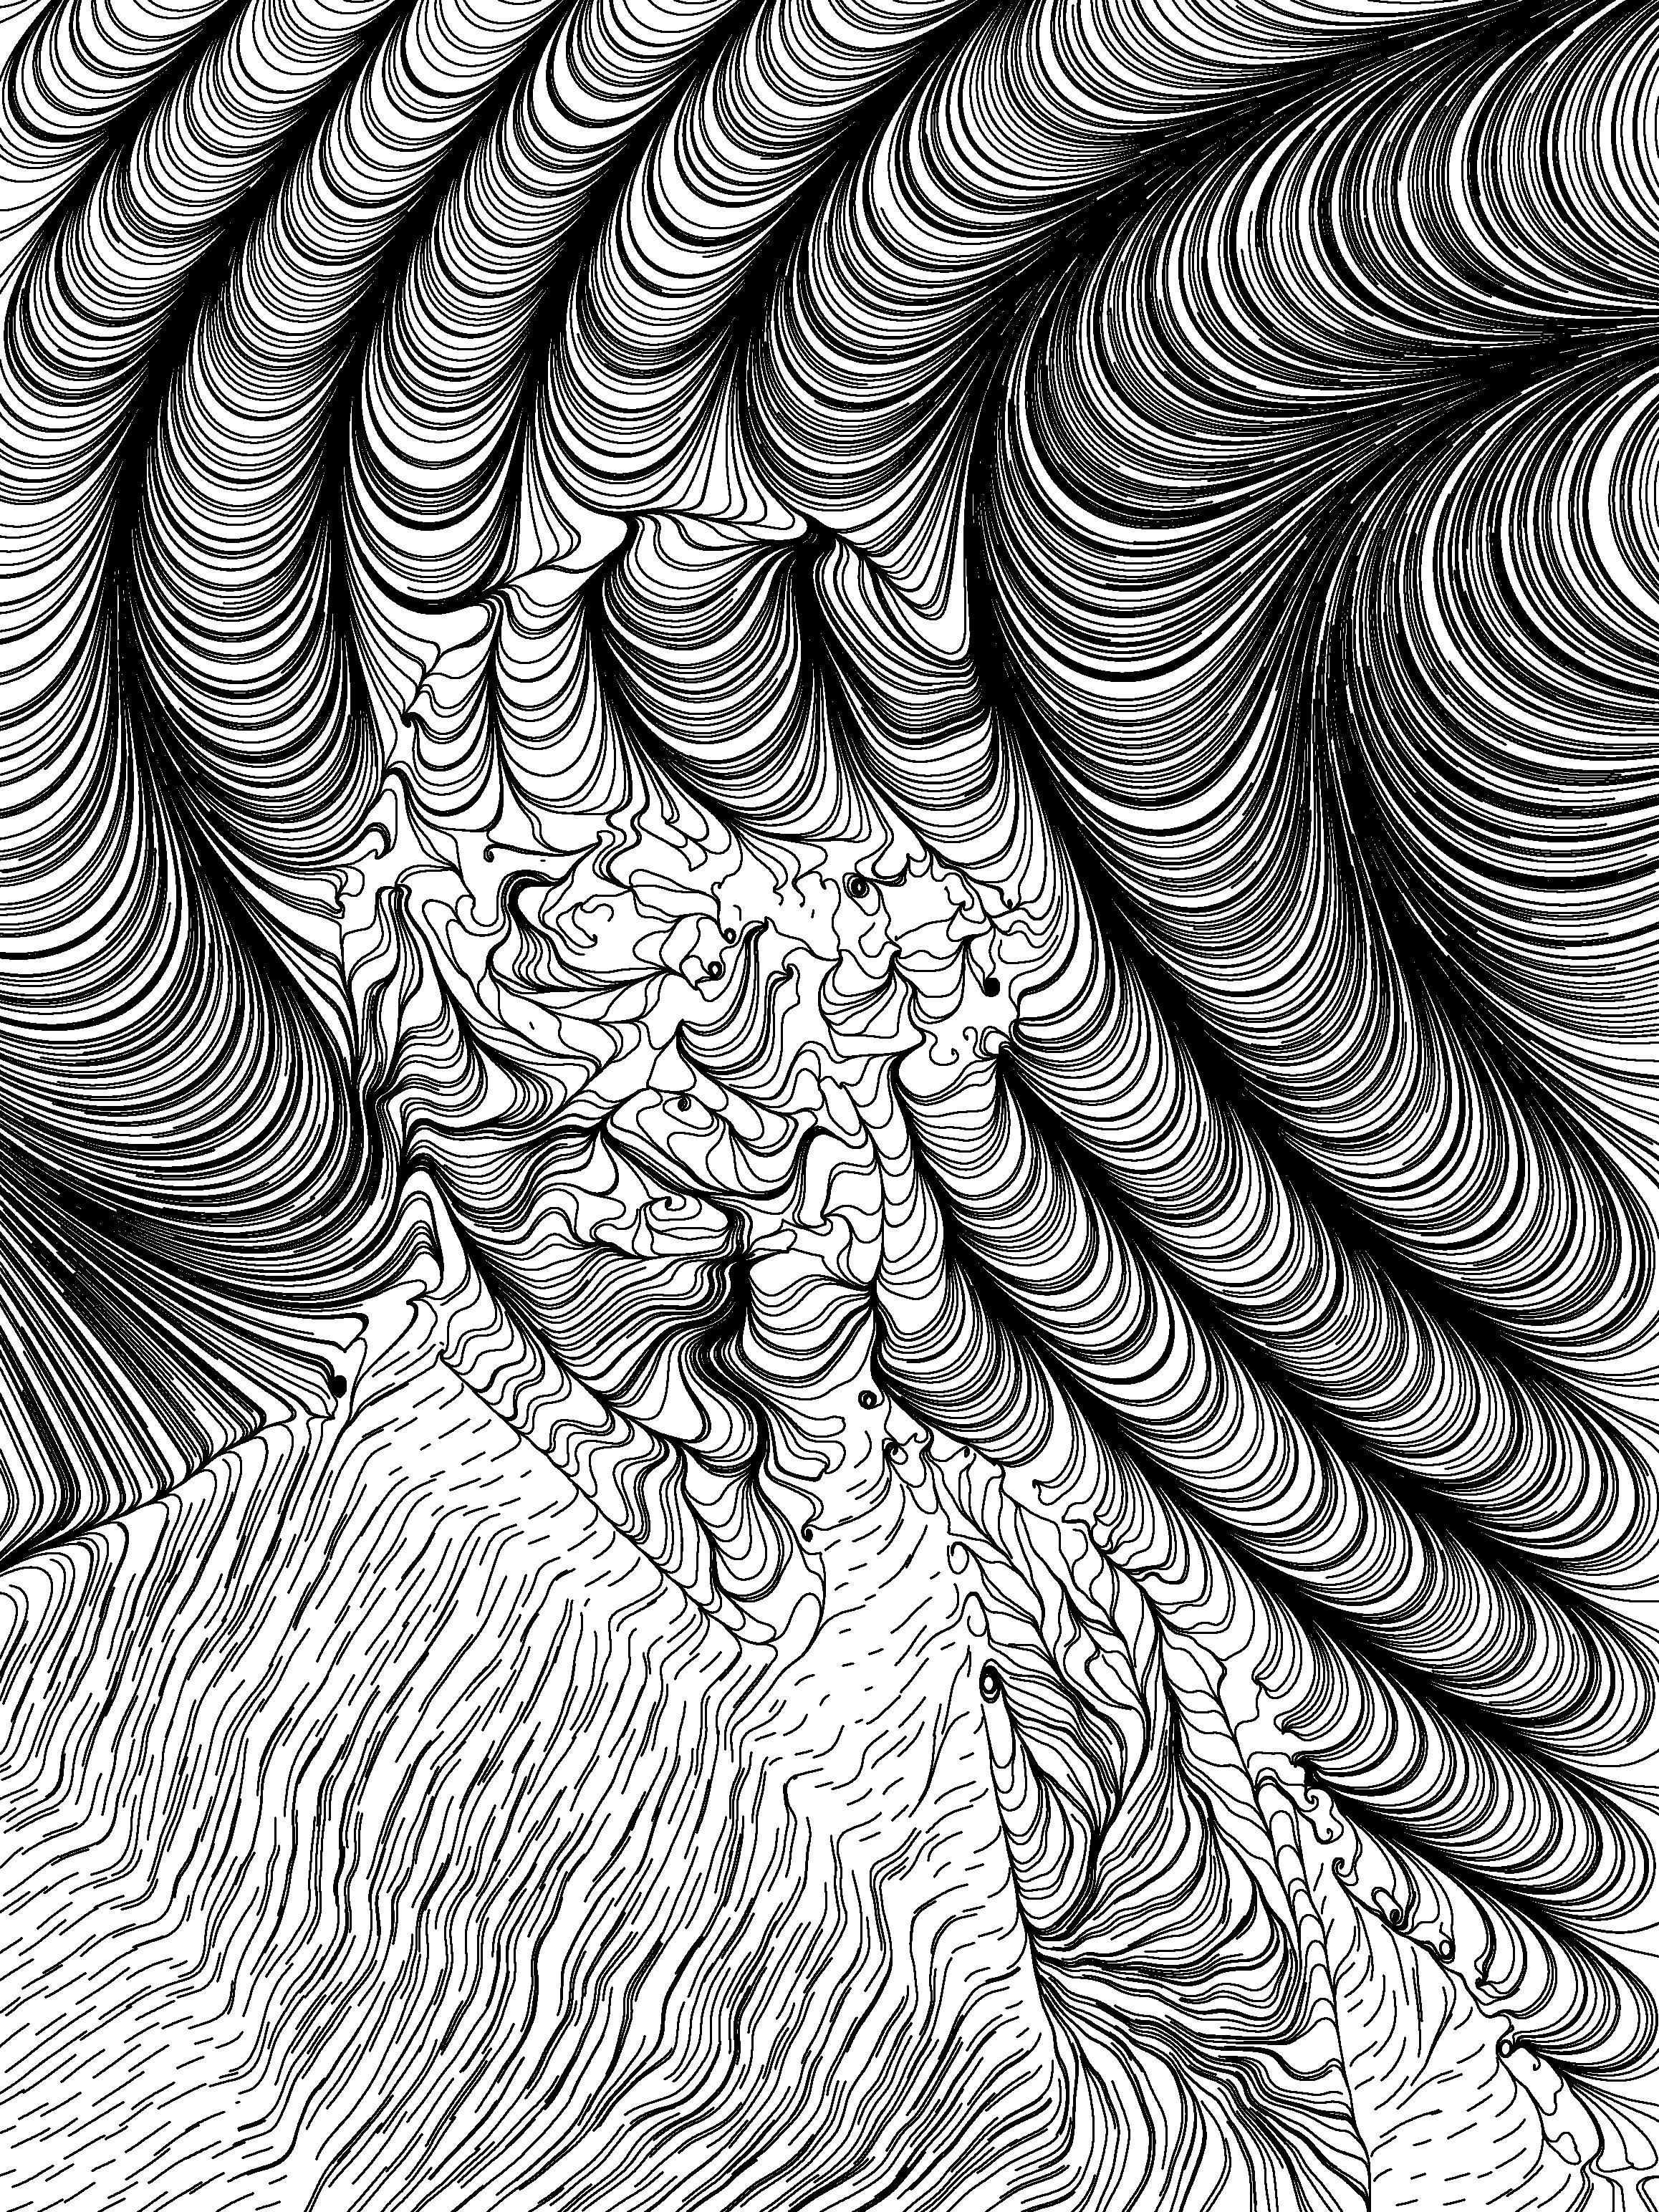
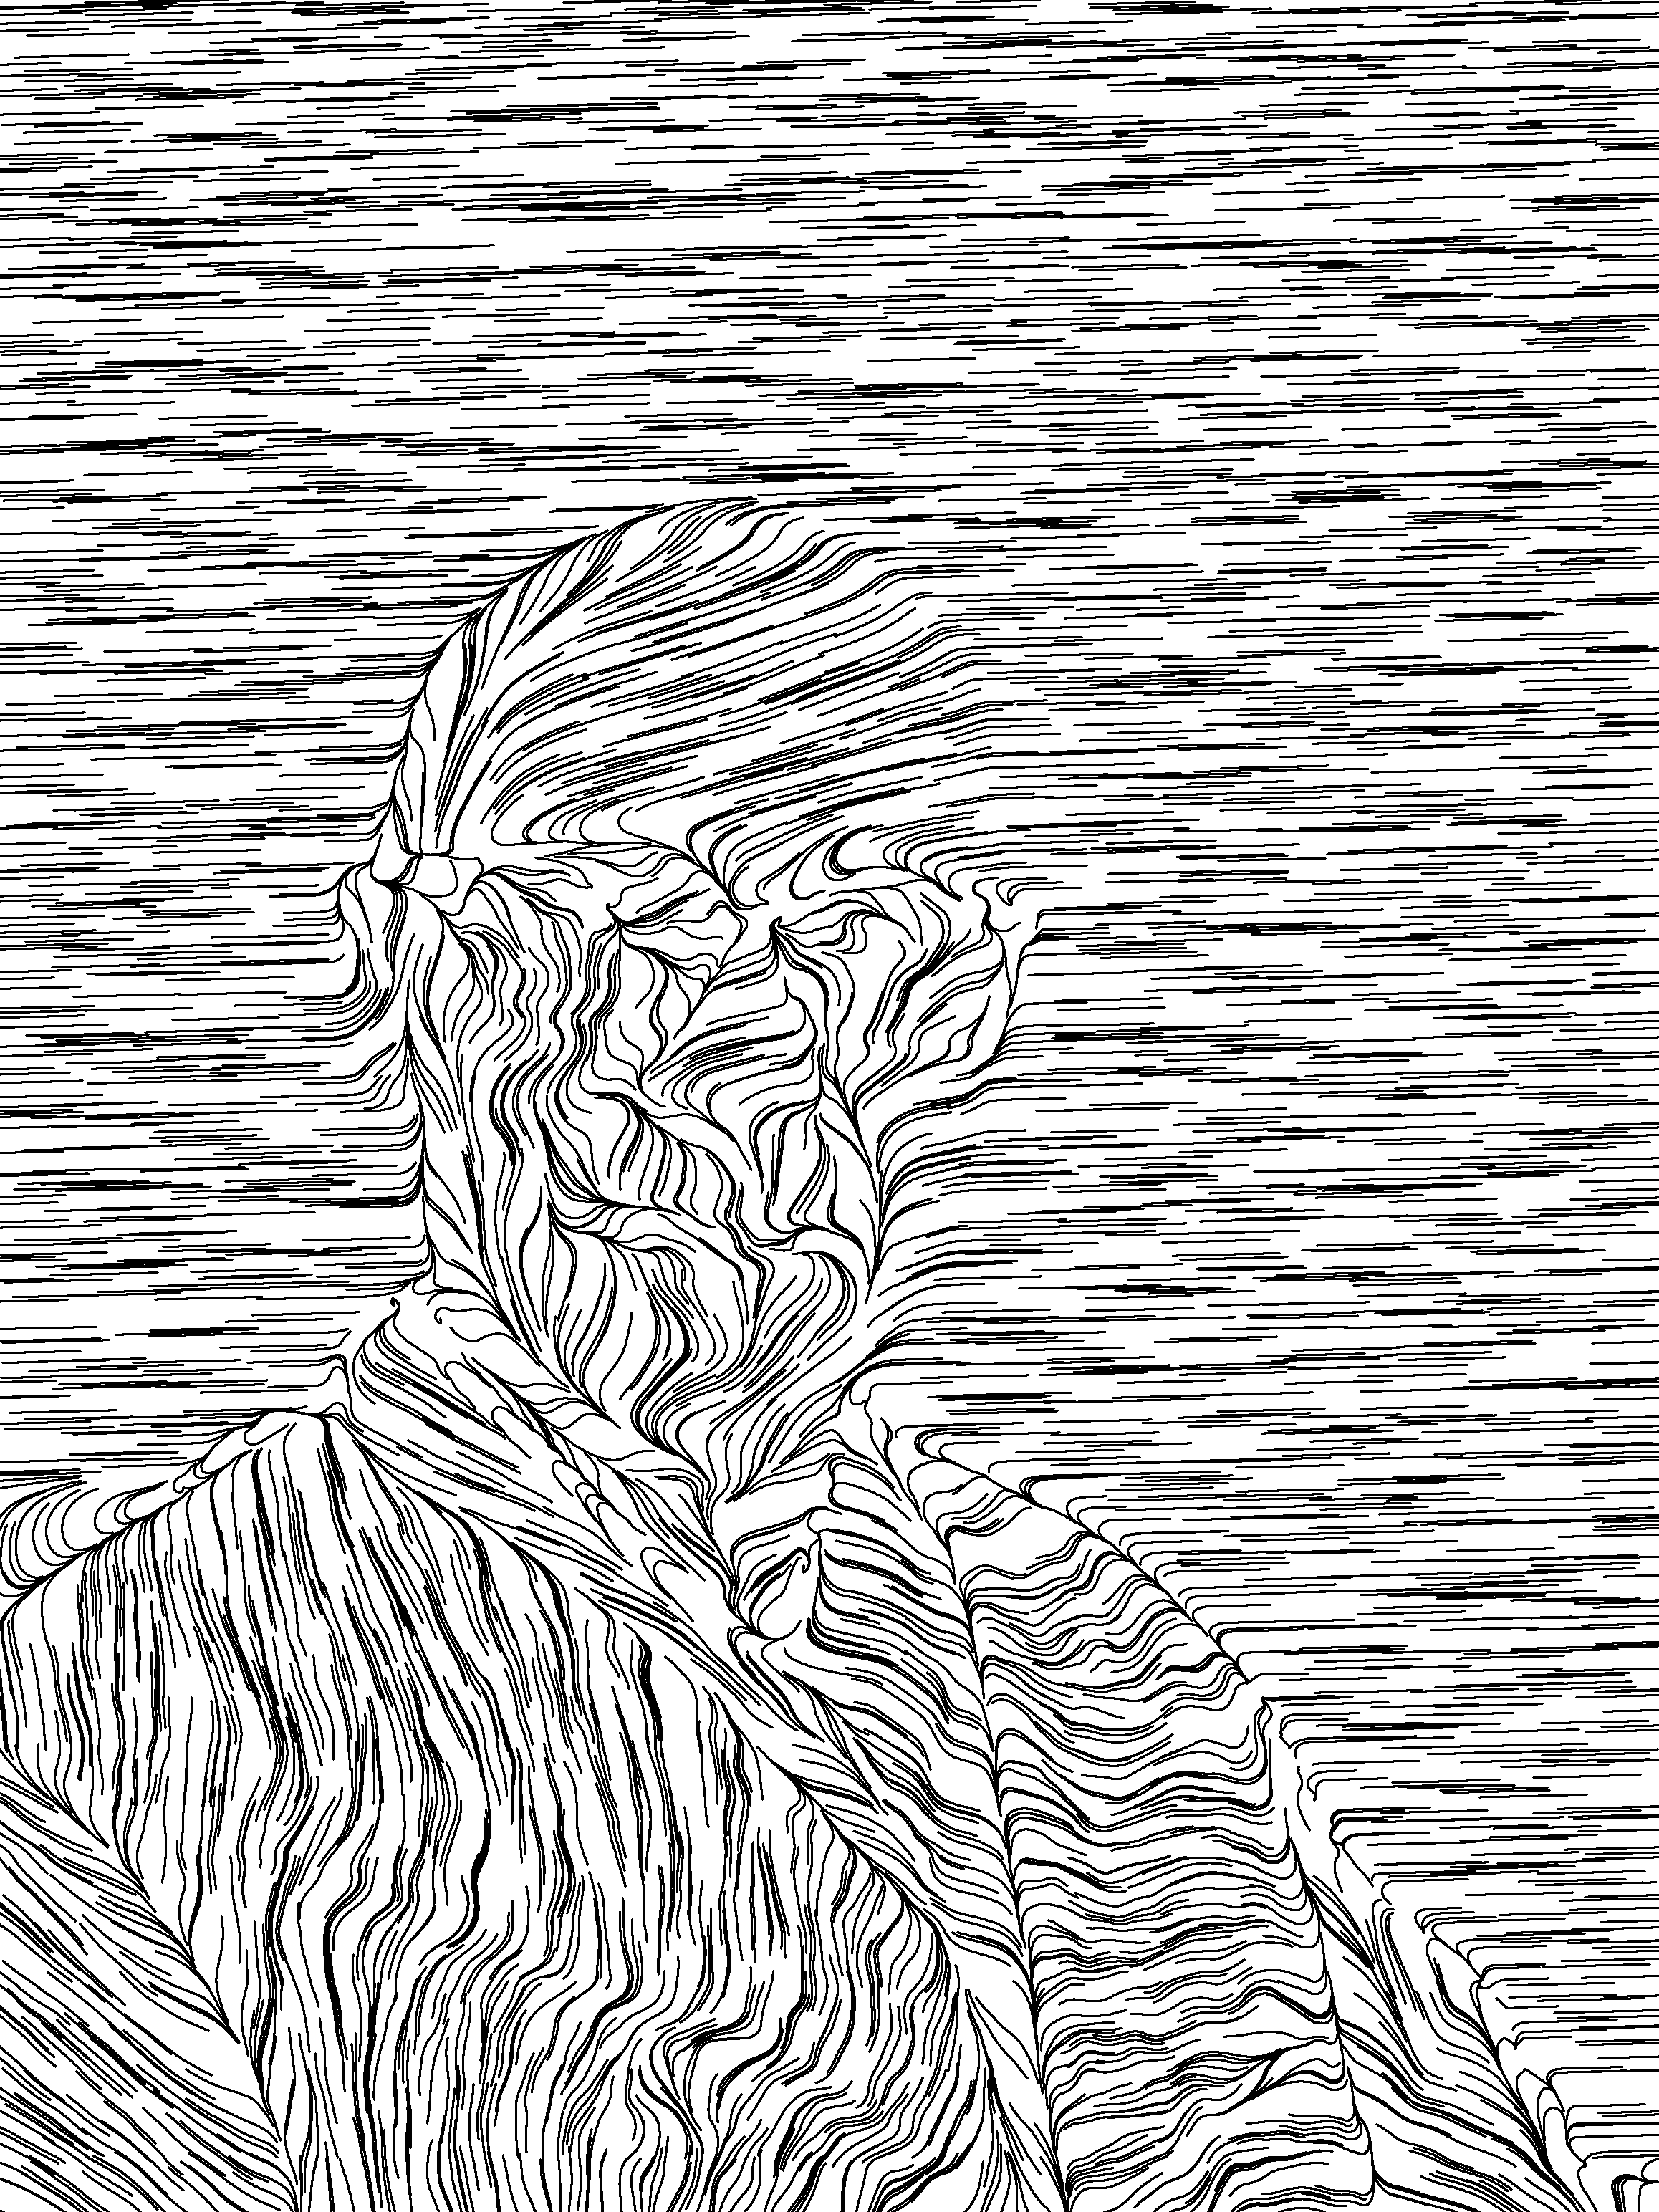
My first breakthrough was when I realized that I could also use OpenCV to draw the lines, cutting down processing times from hours to seconds. The primary difference between OpenCV and MatPlotLib for this use case is how they process images. MatPlotLib holds each of the lines and shapes it draws in memory, then writes them all at once after they are all generated. For images with potentially millions of lines, this is extremely inefficient. On the other hand, OpenCV only holds an array representation of its image in memory, and each draw operation directly changes that image. In some use cases, this could be undesirable since it doesn’t retain any history, but for me, this was a lifesaver.
With this new version, I was able to explore many more variations of my code without worrying about spending hours waiting for images to generate.
Working in Color
Up until this point, I had been working entirely with black and white outputs. While black and white is an excellent way to explore shape and form, I wanted to find some way to include some color to my work.
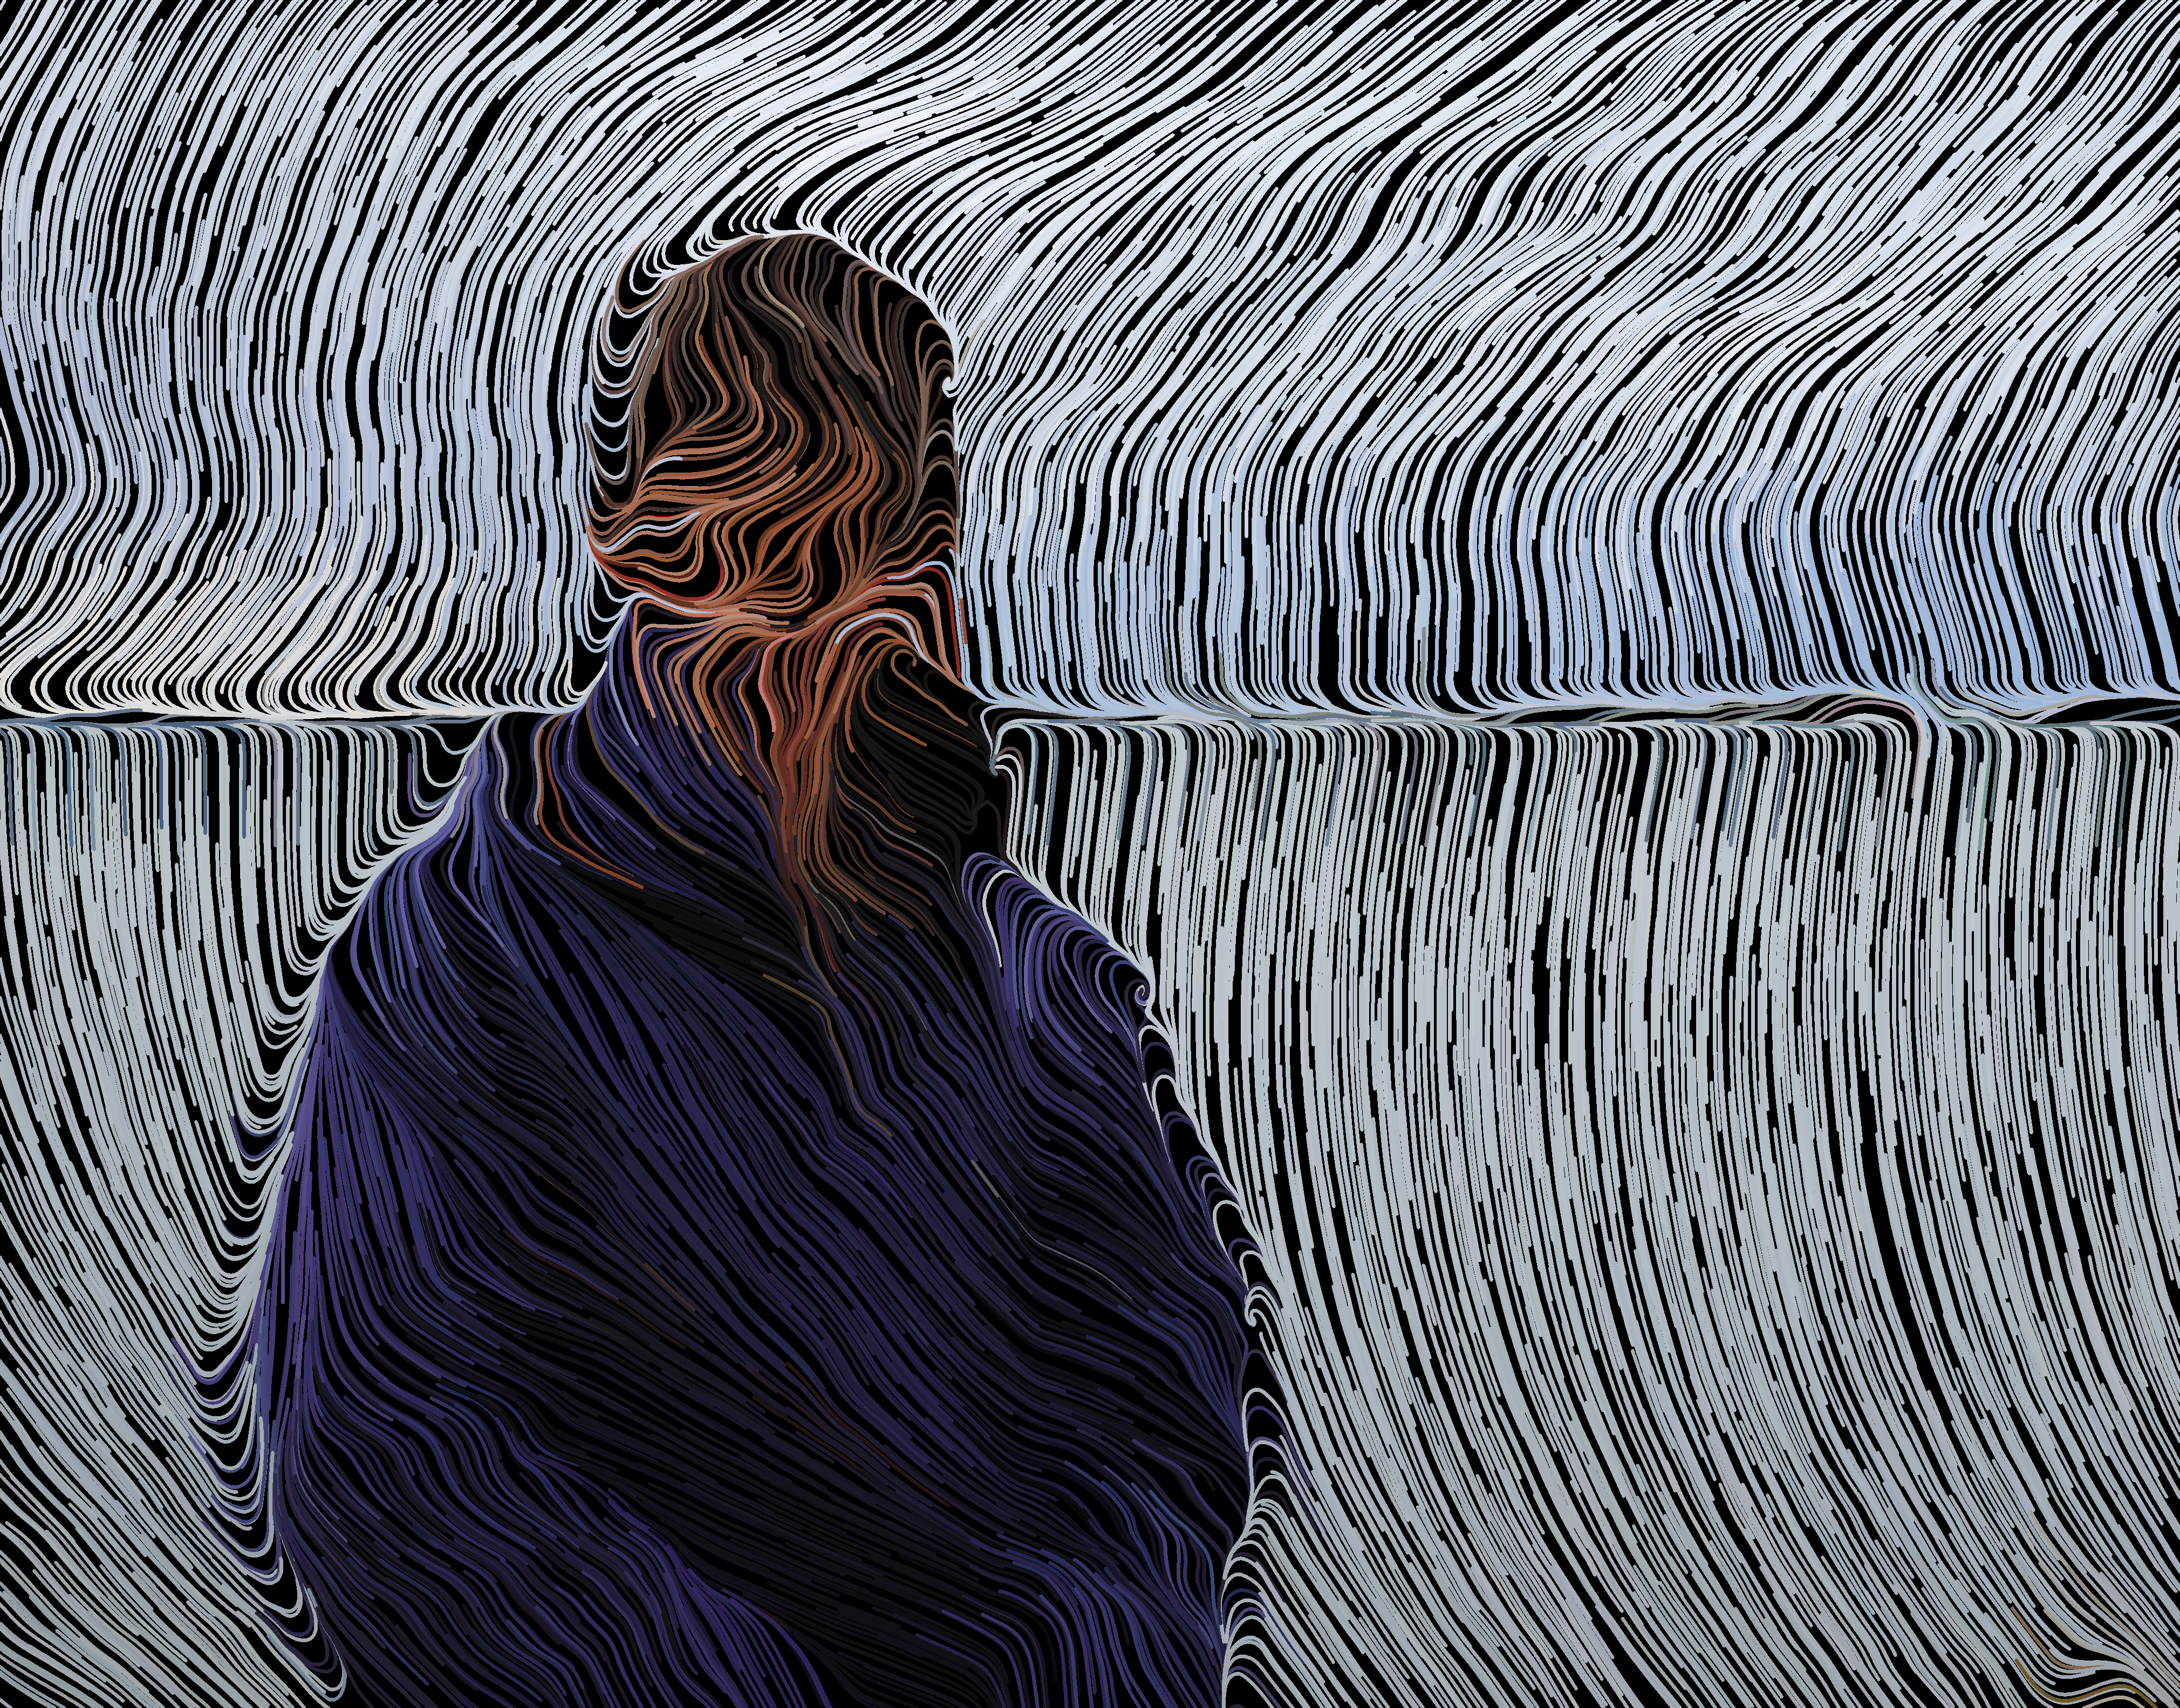
I explored several methods to add color. First, I just colored the lines I drew like the nearest pixel. This resulted in somewhat interesting images, but I still felt like they left something to be desired.
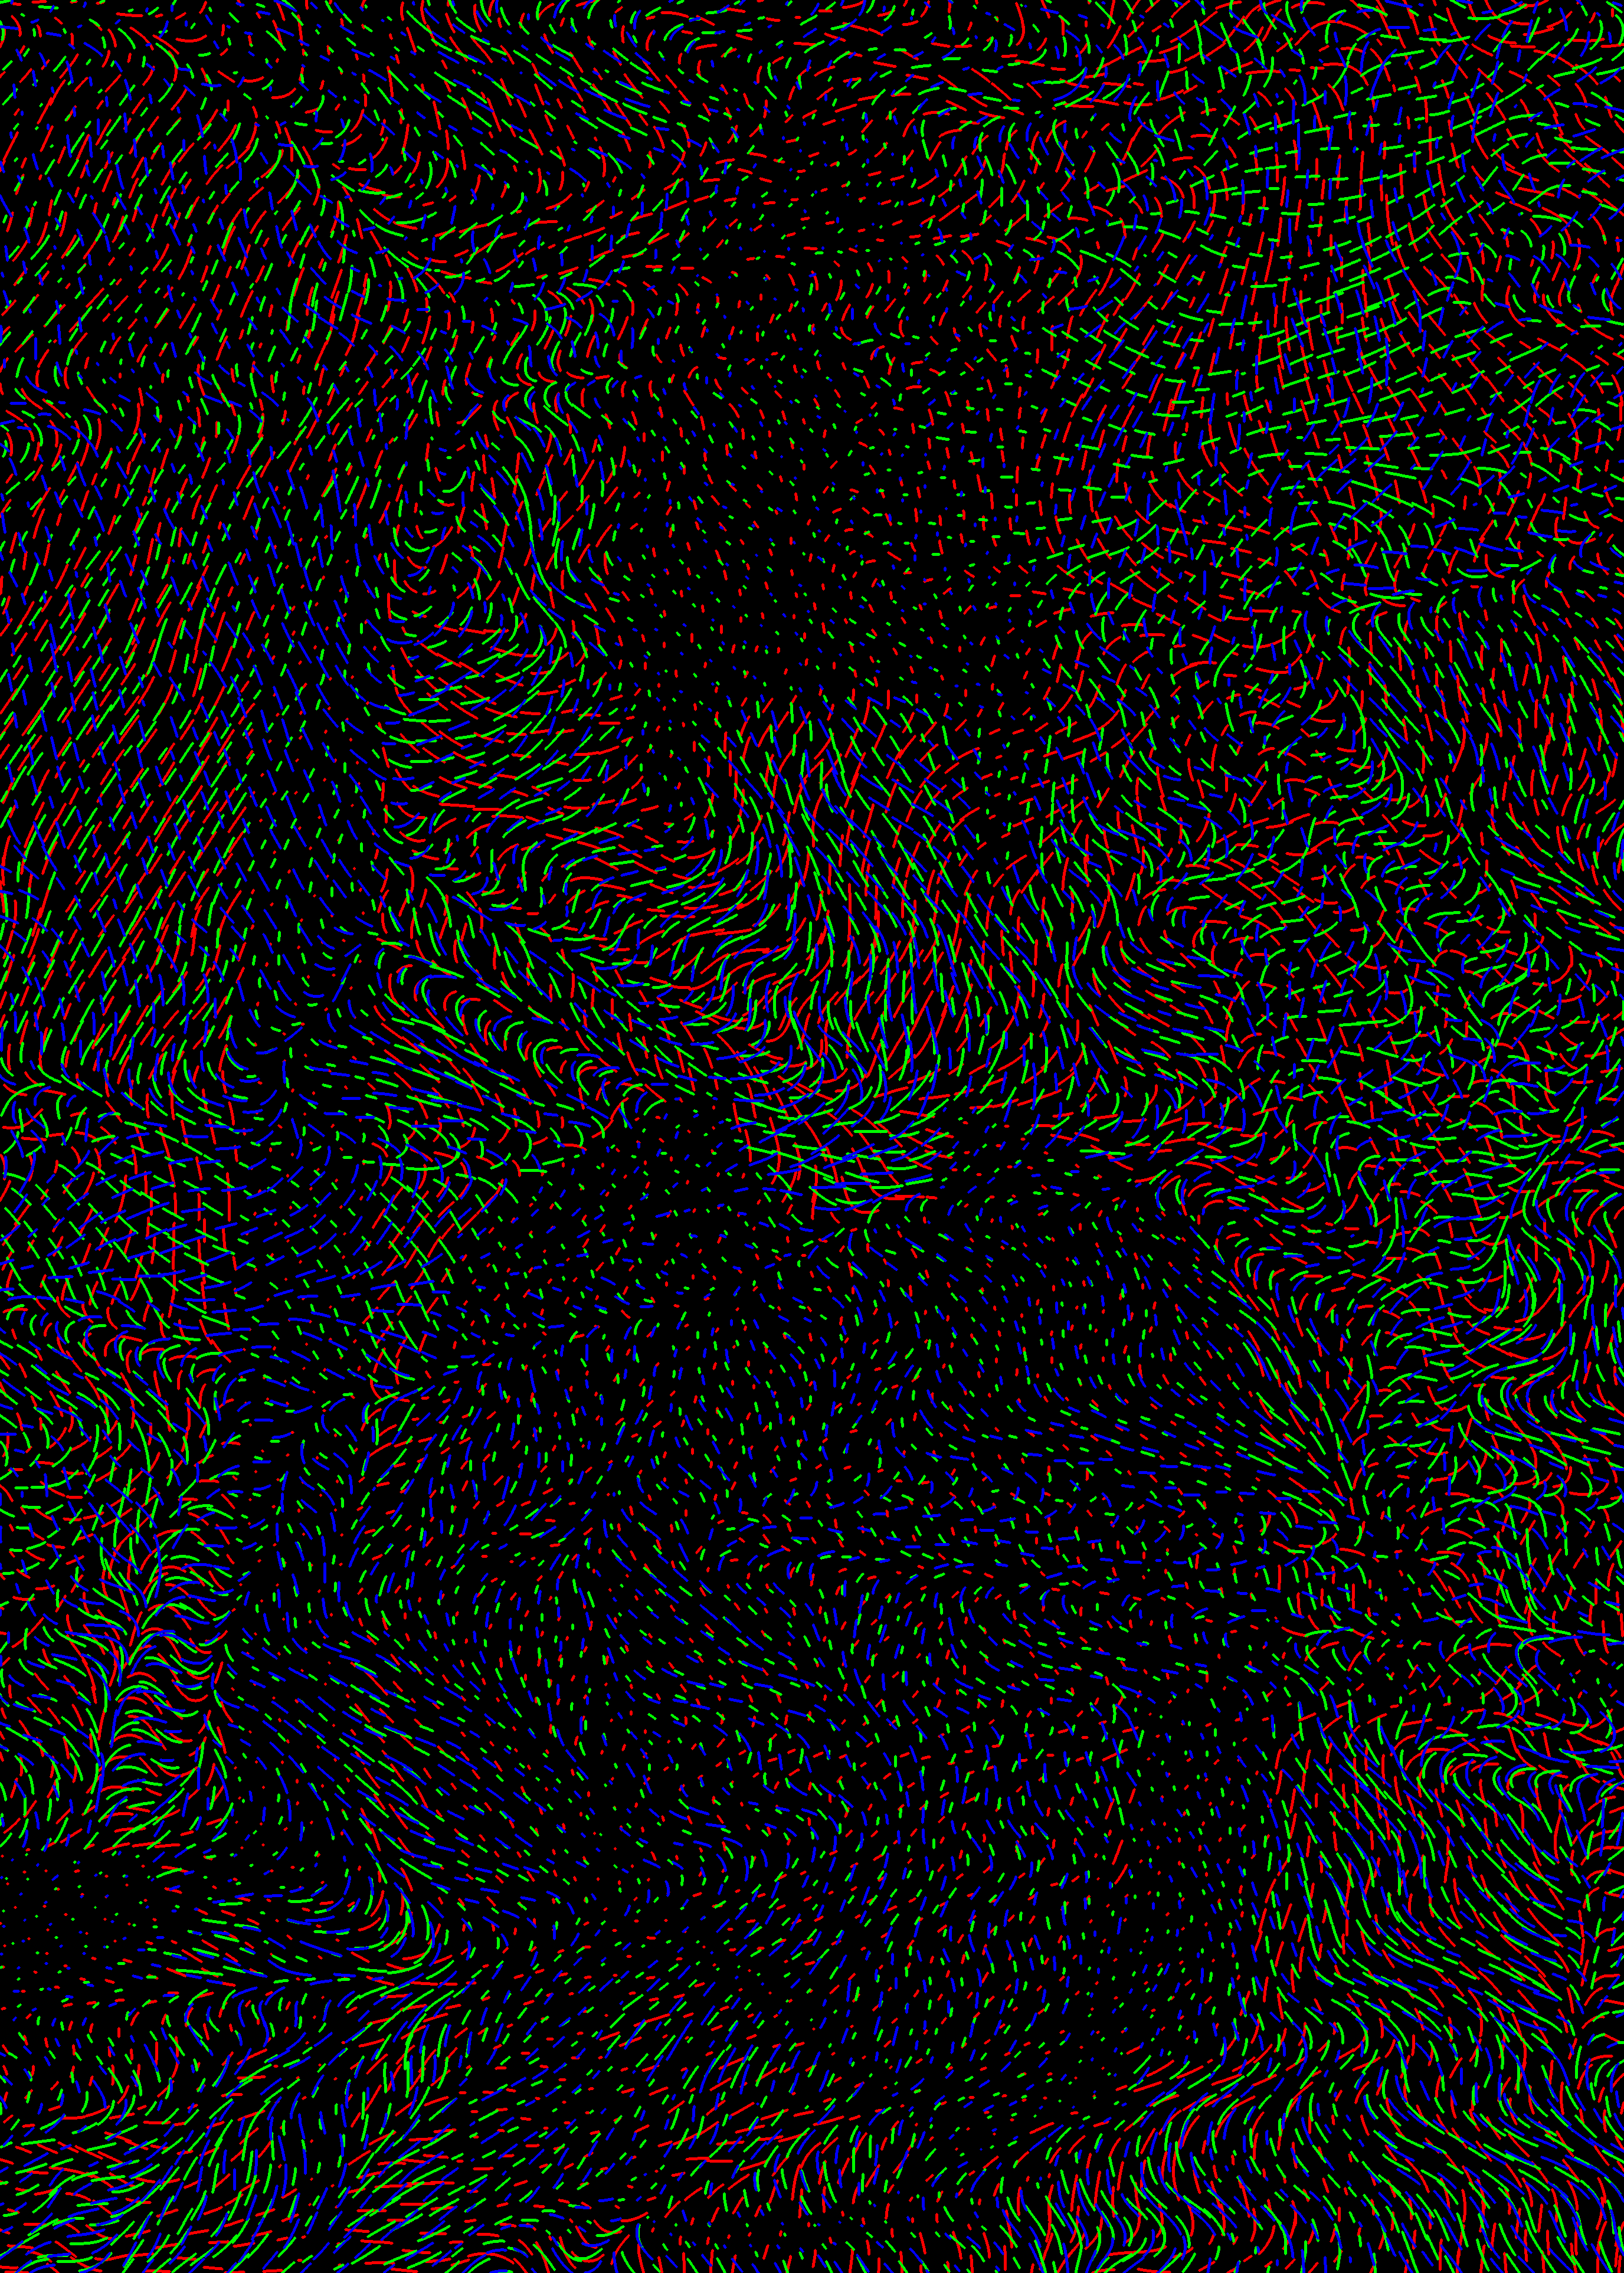
My next idea was to draw three layers of lines. The each layer had lines that matched a particular RGB color channel, and by layering them the image created the semblance of full color. While this created a cool effect, it always leaned towards the channel to be drawn last, since layered lines didn’t blend.
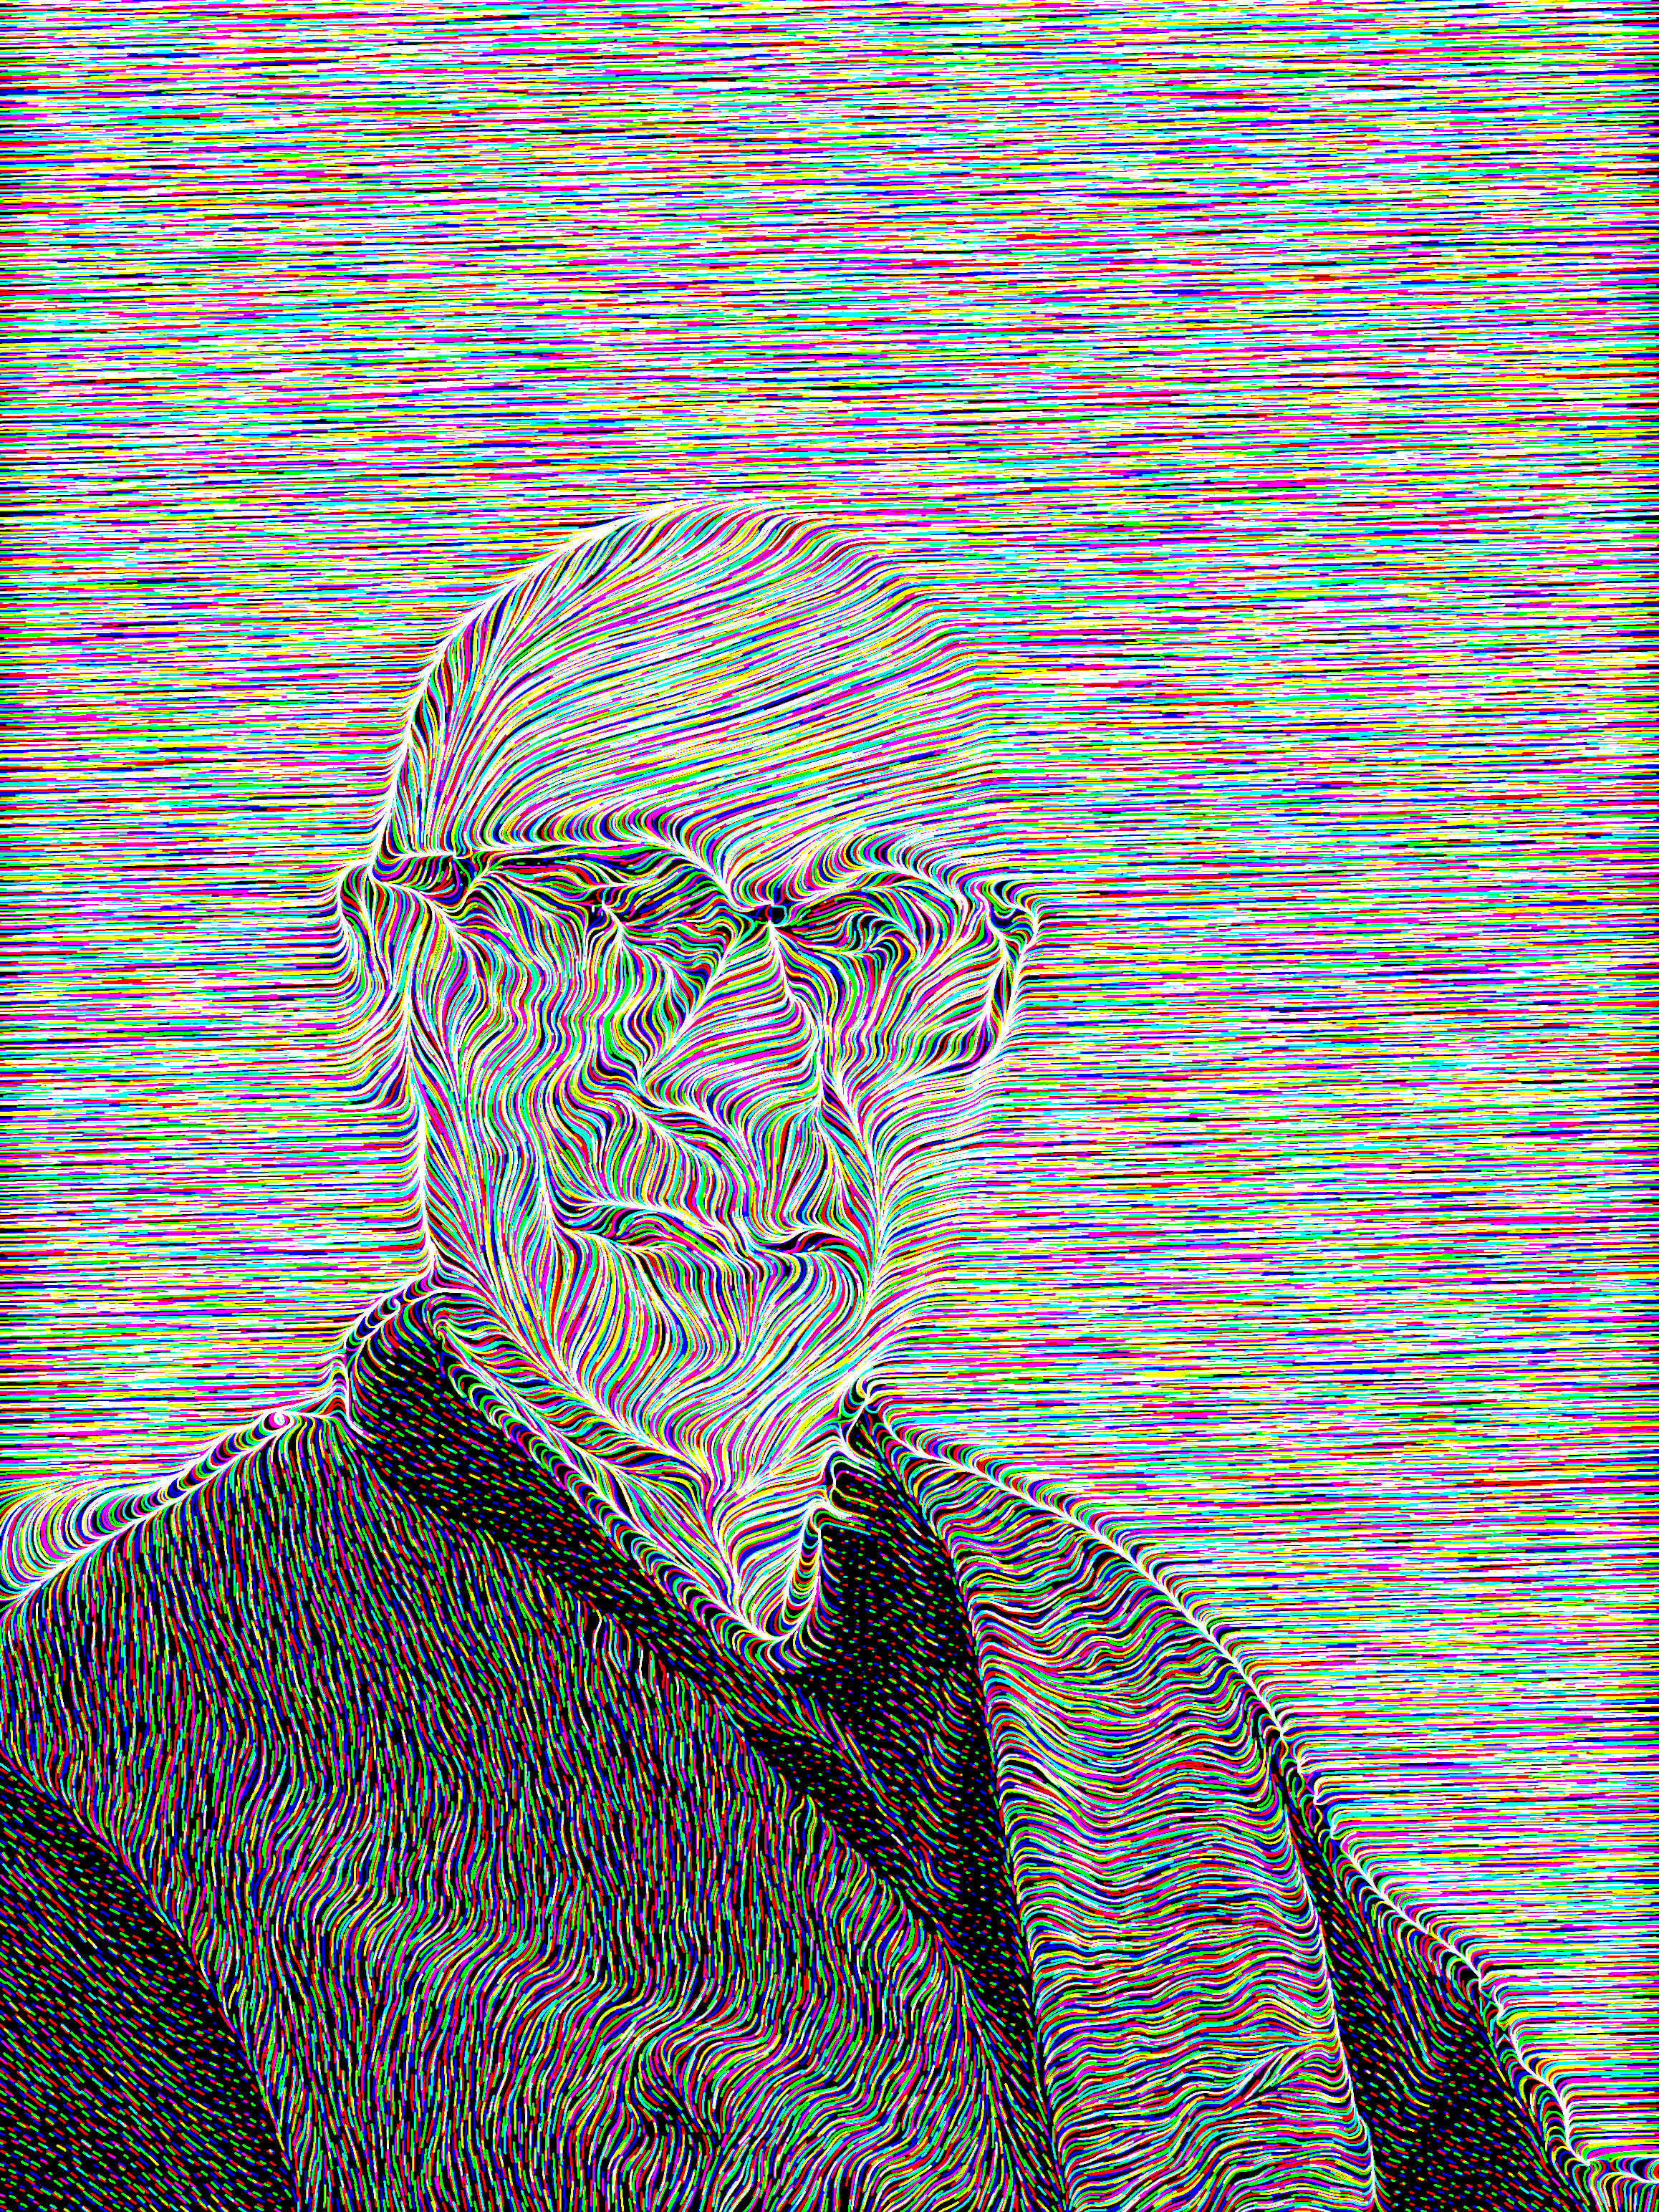
My other main technique was to draw each channel in a separate image, then combine them as color channels so they would blend.
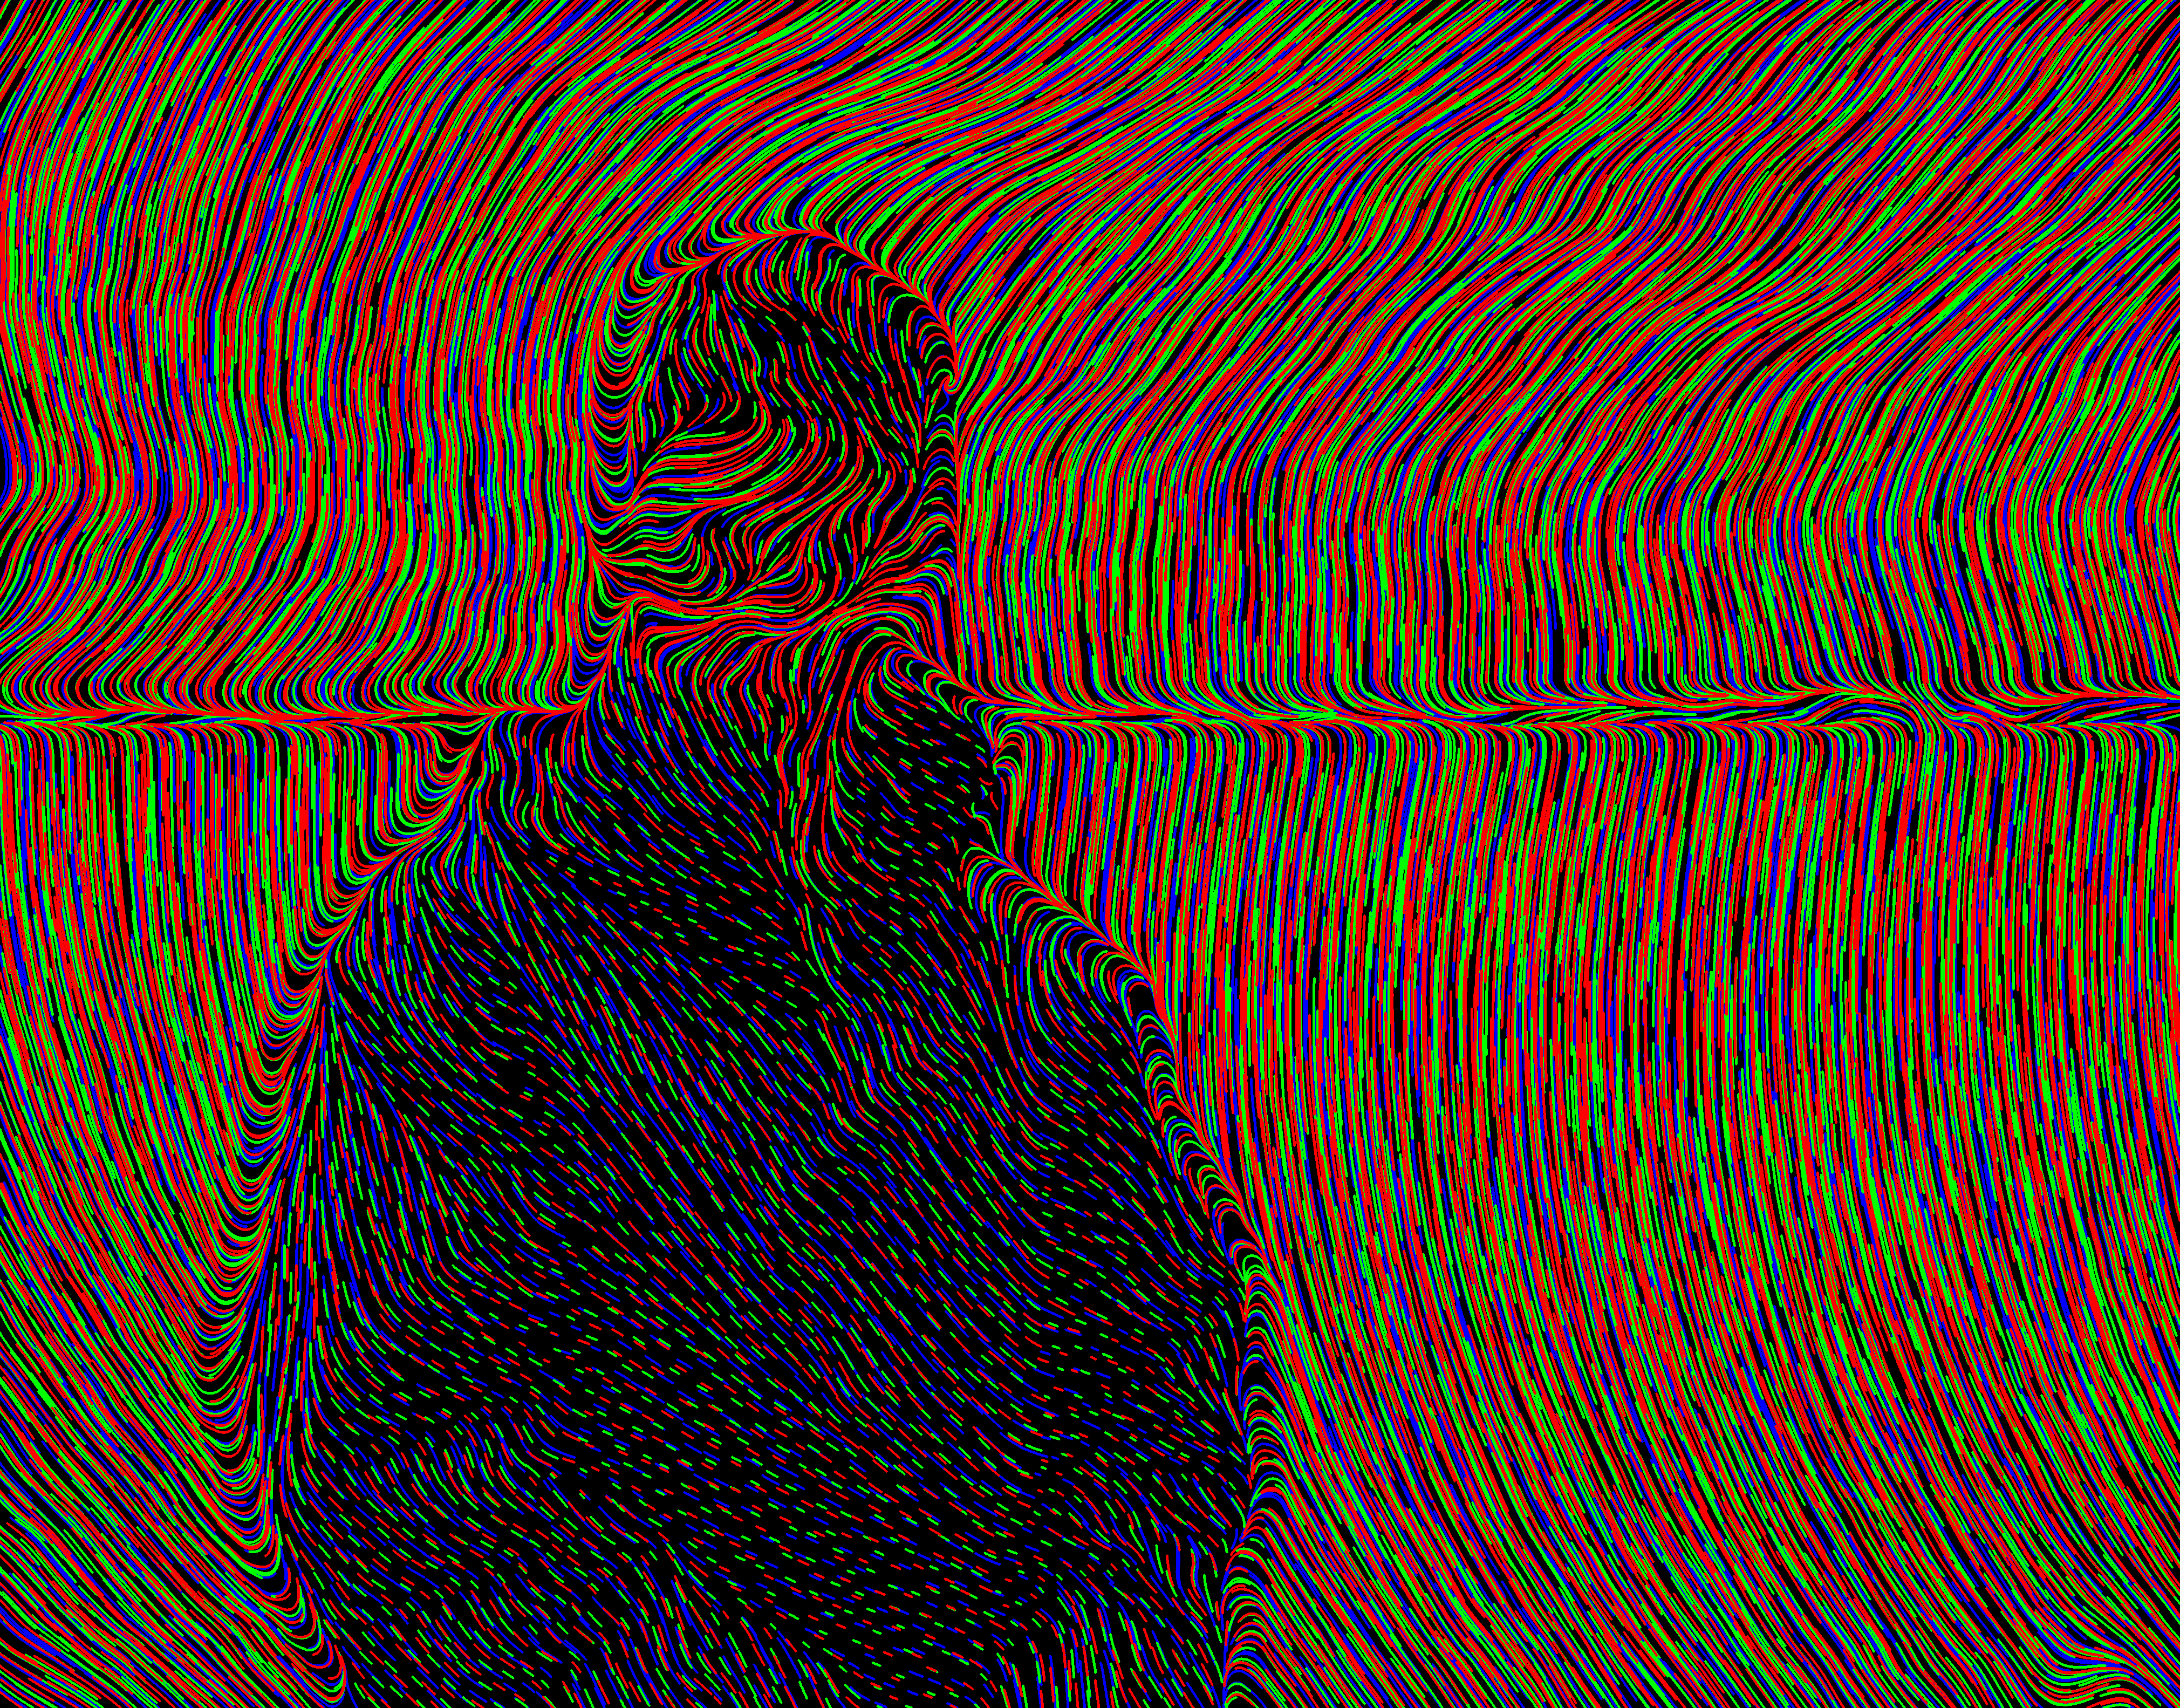
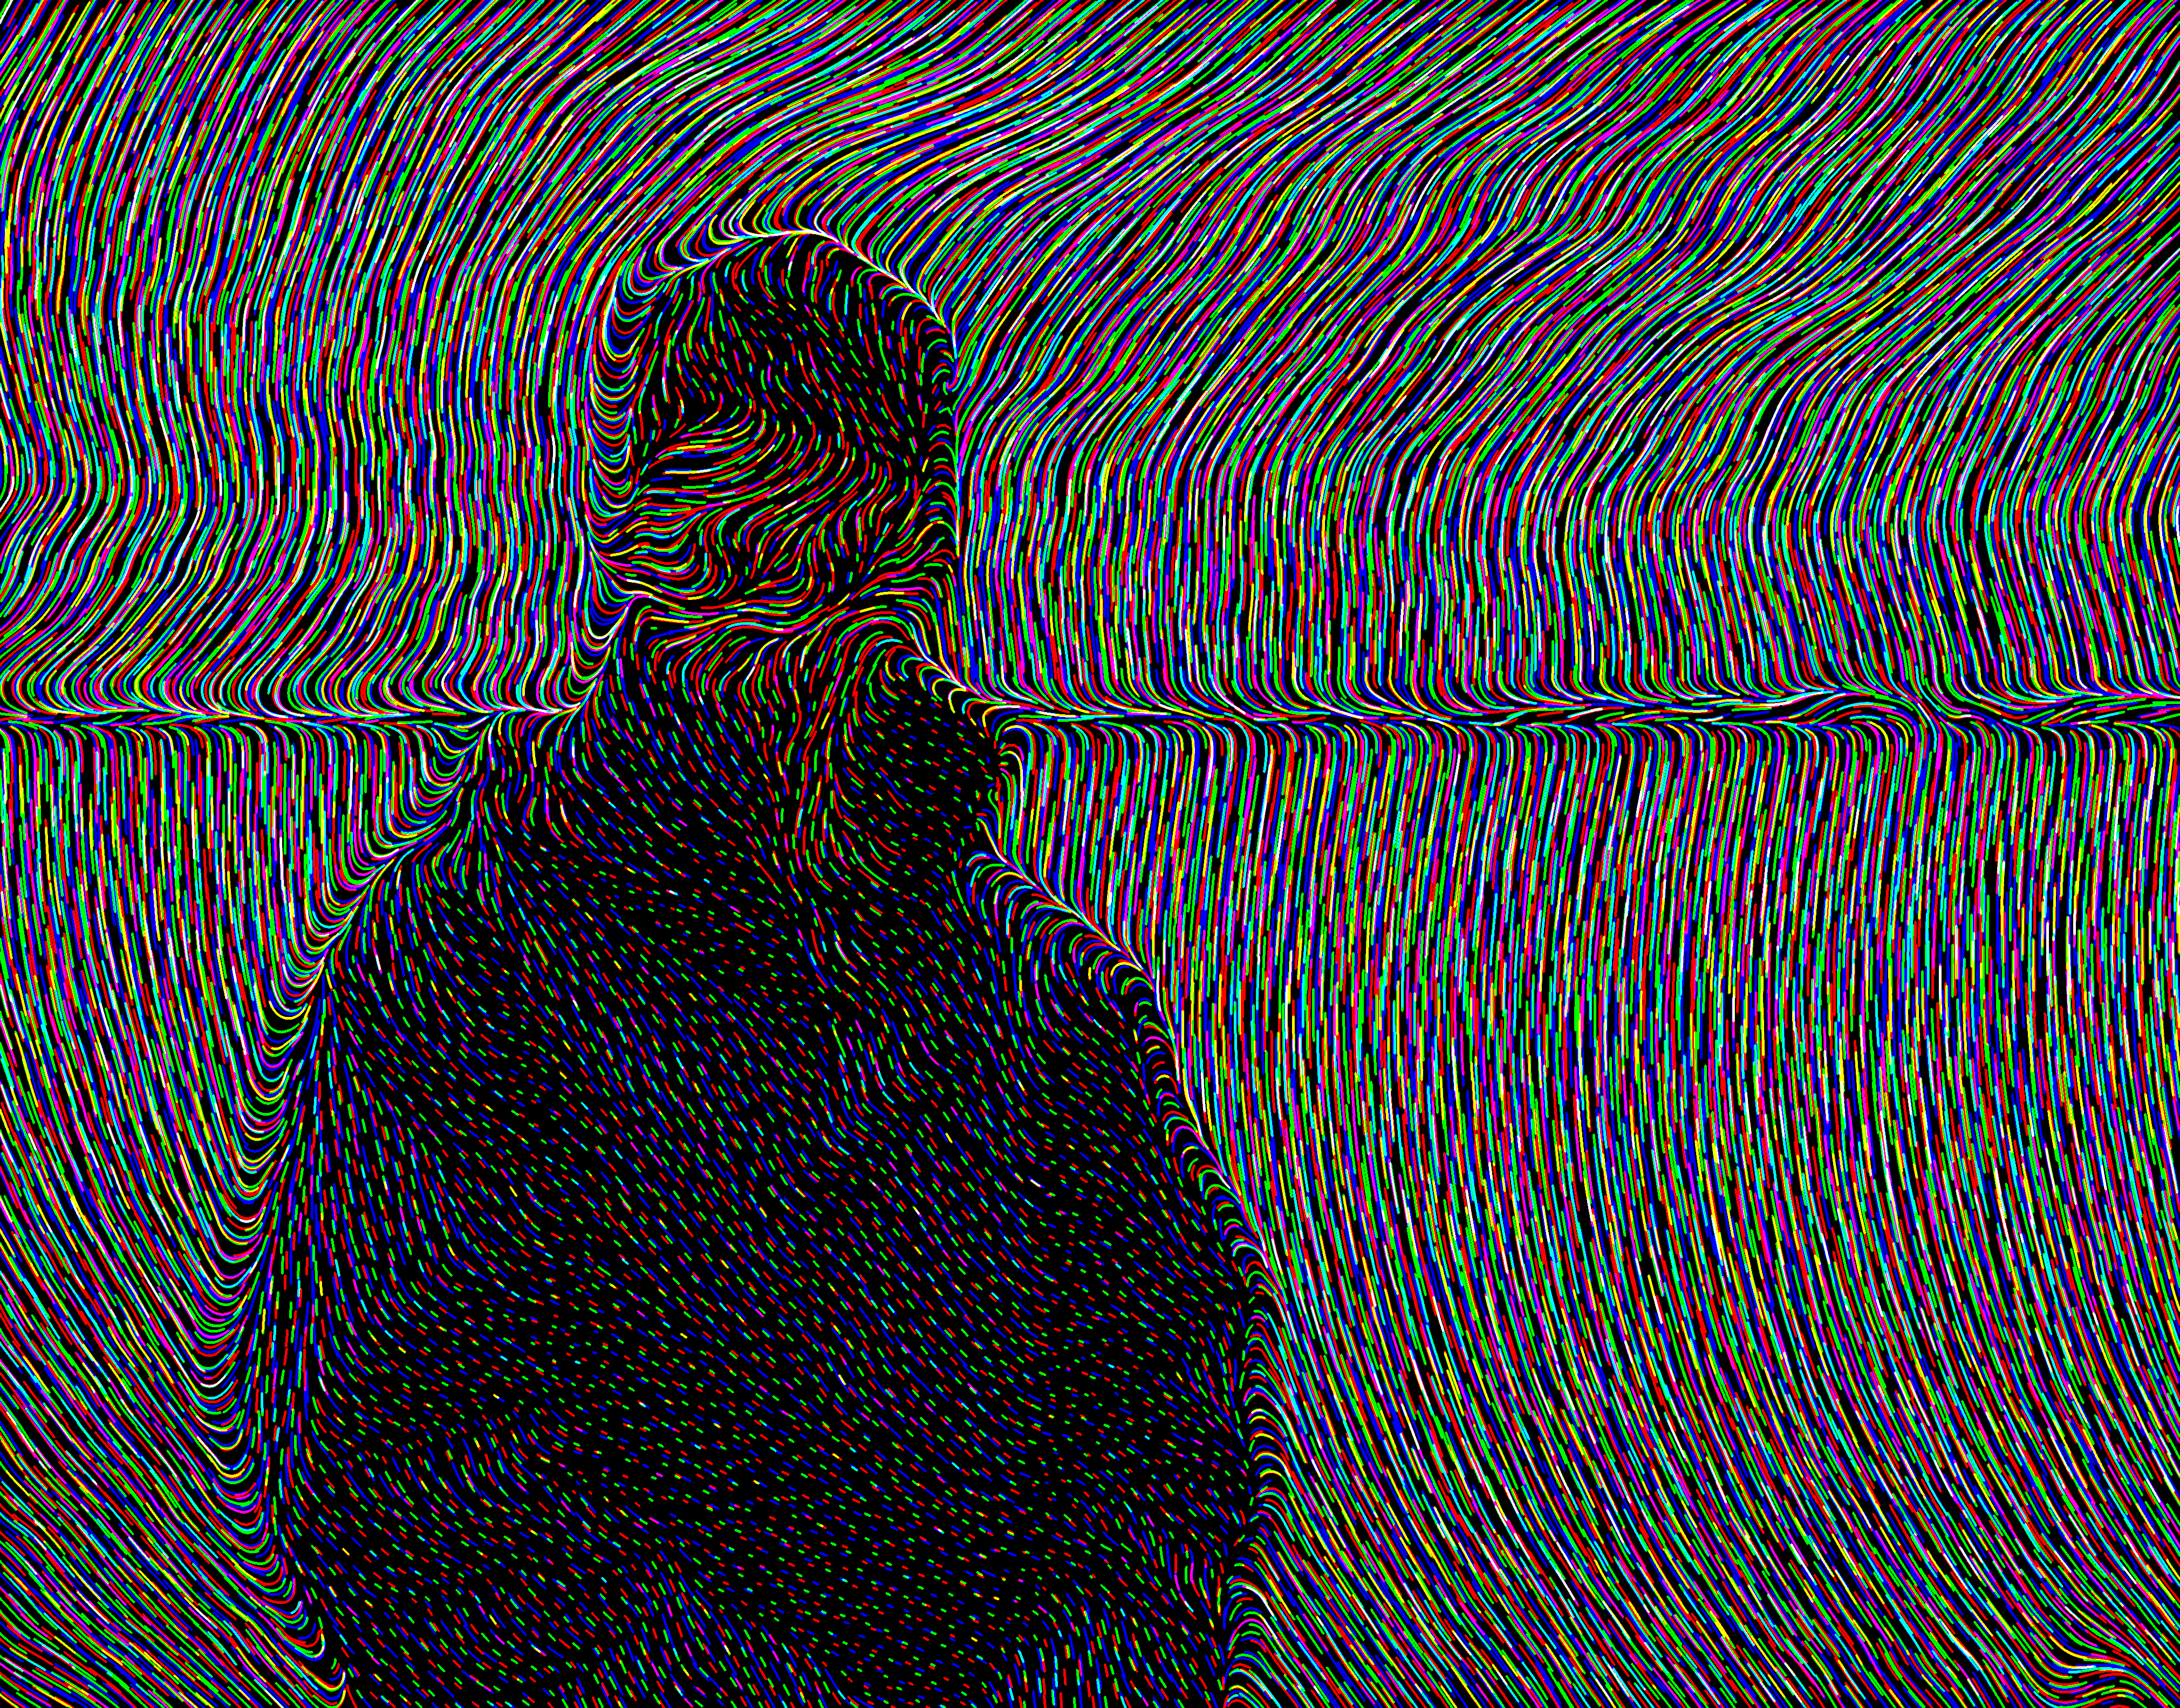
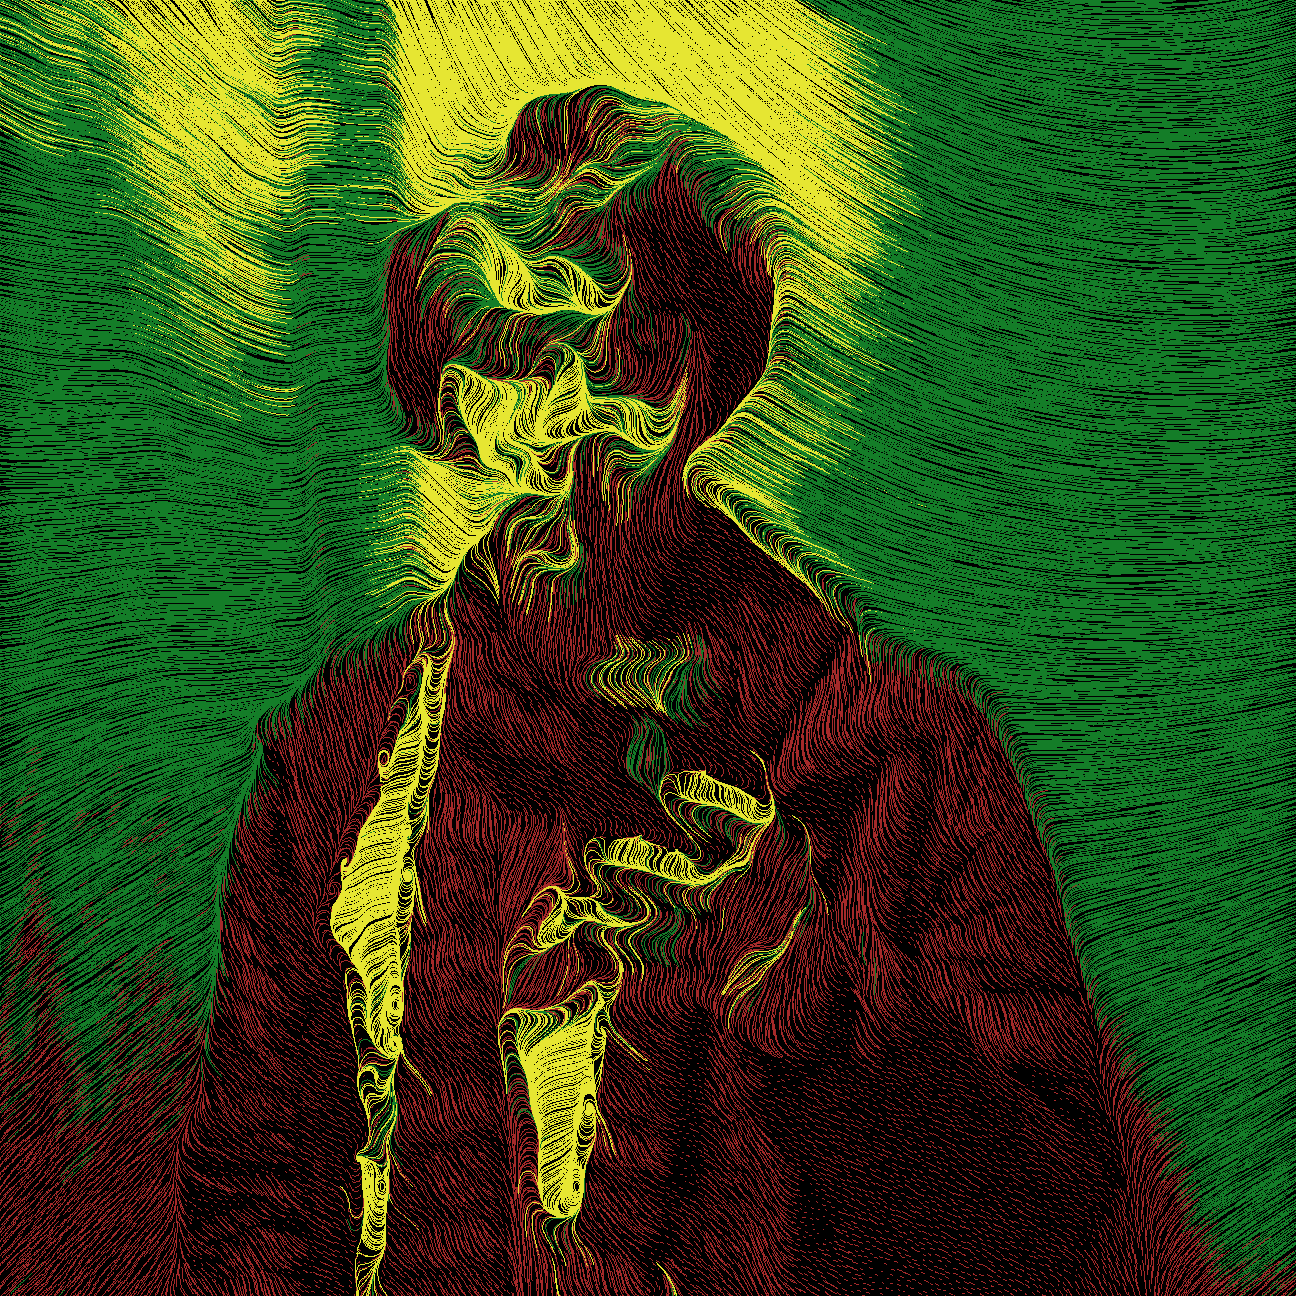
I also experimented with other color spaces and techniques, but I didn’t like them as much.
Check It Out
If you want to play around with it yourself, the project is hosted on my GitHub here